If you want a signal chain to work reliably, you need a clear idea of how much your signal stands above the noise floor. This comes up when chasing down sensor problems, specifying radios, or checking if your audio setup is actually separated from the background hum. This Signal-to-Noise Ratio calculator lets you work out SNR in decibels or as a linear power ratio, or go backward from a given SNR to figure out what signal or noise level you can tolerate. It’s relevant in telecom, instrumentation, audio, and motion control—basically anywhere noise from sensors or the environment affects what you’re trying to measure or transmit. This page covers the main SNR formulas, shows a satellite downlink worked example, and explains major noise sources along with a direct FAQ.
What is Signal-to-Noise Ratio?
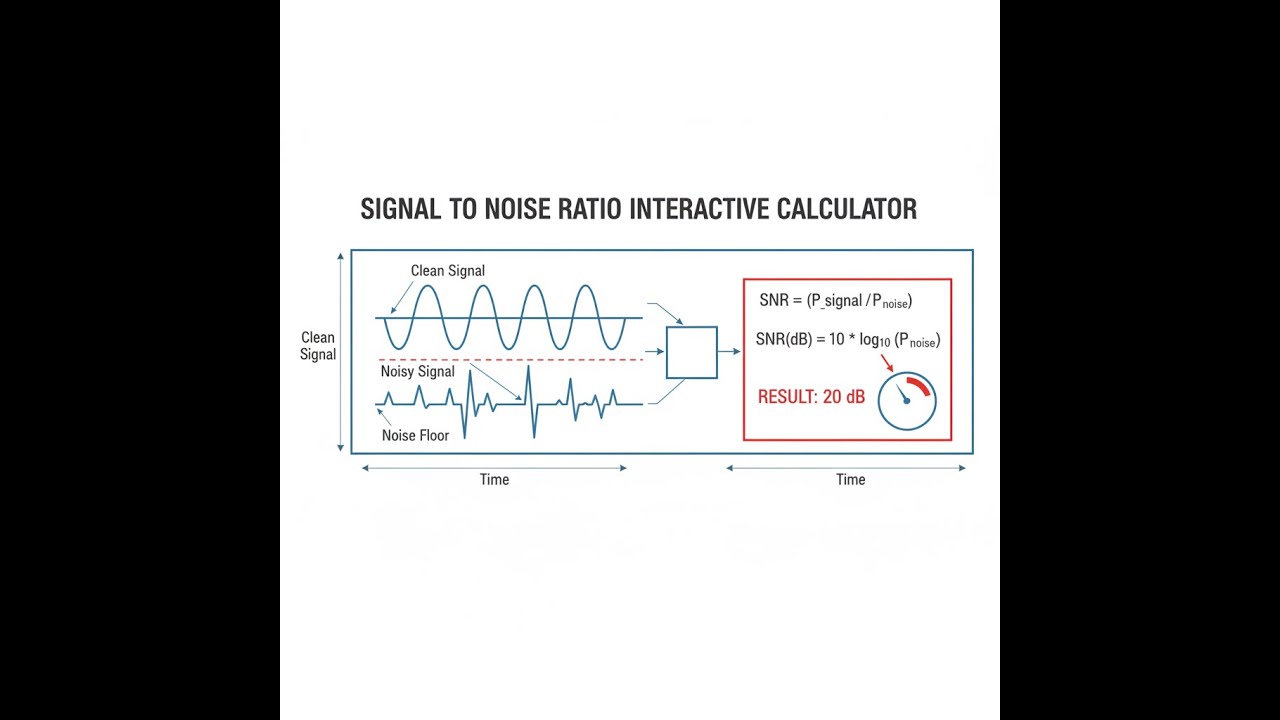
Signal-to-Noise Ratio (SNR) simply compares the strength of what you want (signal) to what you don’t (background noise) in any system. When SNR is high, your signal stands out and you can trust your data or communication. When it’s low, noise starts to cover or distort your information.
Simple Explanation
Imagine listening for someone’s voice in a noisy room. If the room is quiet and they talk at normal volume, that’s high SNR. If there’s a lot of background chatter and they’re not speaking up, your SNR is lousy and you’ll struggle to understand. In circuits and comms, SNR is just a way to state—often in decibels—how much room your signal has above the local noise floor.
📐 Browse all 1000+ Interactive Calculators
Signal and Noise Diagram

How to Use This Calculator
- Pick the calculation mode for your job—choose power, voltage, dB, or run the math backwards as needed.
- Enter your numbers—make sure signal, noise, or SNR values fit the mode you selected, and stick with real positive values (no negative/zero voltage or power).
- Check your entries. Garbage in, garbage out is as true here as anywhere.
- Hit Calculate to see your results.
Interactive SNR Calculator
This calculator is intended for education, concept evaluation, and preliminary design. Results are based on the equations and assumptions described on this page, but cannot account for every real-world load case, tolerance, material property, environmental condition, installation detail, safety factor, code, or regulatory requirement. Verify all inputs, assumptions, units, and results independently before selecting components or using the result in a real application. Safety-critical, structural, medical, lifting, transportation, or regulated applications must be reviewed by a qualified engineer.
Questions about this calculator or found an error? Message our engineering team.
Signal-to-Noise Ratio interactive visualizer
Move the sliders to see how much the signal stands above noise. The results update instantly in dB and as a linear ratio.
SNR (dB)
8.8
LINEAR RATIO
7.5
QUALITY
POOR
FIRGELLI Automations — Interactive Engineering Calculators
SNR Equations and Definitions
Use this formula if you know the power ratio:
SNR from Power Ratio
SNRdB = 10 × log10(Psignal / Pnoise)
Use this one if you’re working with voltages:
SNR from Voltage Ratio
SNRdB = 20 × log10(Vsignal / Vnoise)
For going from dB back to a simple power ratio:
Linear Power Ratio Conversion
Linear Ratio = 10(SNRdB / 10)
To get noise power if you know signal power and SNR:
Noise Power from SNR
Pnoise = Psignal / 10(SNRdB / 10)
Where:
- SNRdB = Signal-to-Noise Ratio in decibels (dB)
- Psignal = Signal power in watts (W)
- Pnoise = Noise power in watts (W)
- Vsignal = Signal voltage RMS in volts (V)
- Vnoise = Noise voltage RMS in volts (V)
- log10 = Logarithm base 10
Simple Example
If your signal power is 100 W and your noise power is 1 W:
Linear ratio = 100 / 1 = 100.
SNR = 10 × log₁₀(100) = 20 dB.
This is a solid SNR and good enough for most real-world setups.
Theory & Practical Applications of Signal-to-Noise Ratio
Fundamental Physics of Signal-to-Noise Ratio
SNR just directly states how big your intended signal is compared to the unavoidable mess of background noise—all kinds, in any system that transmits or measures. Engineers use dB because systems can run anywhere from SNRs worse than zero up to SNRs in the hundreds, and dB keeps the math sensible. Add 3 dB and you’ve doubled your power; 10 dB gives you ten times the power. Decibels keep things straightforward, no matter the scale of your signals.
There’s a reason we use different multipliers for power and voltage in these equations. Power scales as the square of voltage or current, so for voltages, you use 20×log₁₀, not 10×. This only holds true if both your signal and noise share the same impedance—which is not a given, especially in RF or any system where matching isn’t perfect or things are non-linear.
Noise Sources and Their Physical Origins
Thermal noise—sometimes called Johnson or Nyquist noise—comes from thermally driven random electron movement in conductors. You see it anytime you have resistance above absolute zero. The classic equation (Pₙ = 4kTBR) sets the noise floor. In a 50-ohm system at 290 K with 1 MHz bandwidth, you’re looking at roughly -114 dBm no matter what you do, because physics says so.
Shot noise pops up wherever charge arrives in discrete packets, like semiconductors and vacuum tubes. For example, in photodiodes under low light, shot noise often outruns thermal noise and you hit a quantum limit. For 1 μA through a photodiode at 1 MHz bandwidth, shot noise is about 0.57 pA/√Hz—tiny, but it matters when you’re reaching for ultimate sensitivity.
Flicker noise (1/f noise) is a headache at low frequencies and is usually due to imperfections in materials. It’s unavoidable in semiconductors below maybe 10 Hz. Lab gear gets around this by filtering, AC coupling, or modulation techniques like chopping. Depending on the device, you might see the flicker noise crossover at 1 Hz or at up to 1 MHz in less-than-ideal silicon.
SNR Requirements Across Engineering Disciplines
For digital comms, required SNR depends on your modulation and error rate target. For example: BPSK with a 10⁻⁶ bit error rate wants ~10.5 dB SNR; 64-QAM is closer to 24 dB. These aren’t random—they come straight from how noise overlaps the “decision boundaries” in your constellation. Modern coding (like turbo or LDPC) lets you trade bandwidth for operating closer to the Shannon limit, sometimes running meaningful data through channels at SNRs below 0 dB.
For audio, human hearing sets the bar. Professional audio shoots for 90 dB SNR and higher. FM radio at 40-50 dB is fine for most listeners; AM is still intelligible at 20 dB. These numbers reflect both technical limits and how much your brain is willing to tolerate before you start noticing distortion or hiss.
Instrumentation is often limited by real noise at the sensor or front-end amp. A 24-bit ADC seems impressive (144 dB range), but you’ll rarely see conditions that quiet. For example, at room temp in 1 kHz bandwidth, noise on a 50Ω resistor is already -124 dBm, so getting actual 24-bit performance out of an ADC will require serious measures—such as lock-in amplifiers, which work by aggressively narrowing bandwidth to scrape away at the noise floor.
Non-Obvious Engineering Considerations
SNR drops as bandwidth increases, simply because more noise creeps in. Doubling bandwidth doubles integrated noise, so SNR takes a 3 dB hit unless your signal gets stronger too. This is why narrowband systems are used whenever the signal is weak—think deep space comms or radio astronomy. Integrate long enough or narrow the bandwidth enough, and you can see signals much weaker than the noise—if you have patience.
If your receiver is phase-coherent, you get better SNR for a given level of errors compared to envelope detection. A phase-locked coherent system can dig out weaker signals before error rates climb, which is why satellite ground stations and weak-signal links spend extra on stable oscillators and phase-tracking. The difference isn’t academic—a 3 dB improvement means you can halve your transmit power or, for satellites, shrink your launch mass.
FM radio uses pre-emphasis (boosting highs at the transmitter, rolling them off at the receiver) to compensate for the way noise stacks up in the high-frequency band. It gives a subjective 10–15 dB SNR boost for speech and music but doesn’t work for wideband data, where you can't mess with the spectrum shape this way.
Worked Example: Satellite Downlink Analysis
Here’s how the numbers work out in a satellite downlink at 11.7 GHz, with typical—if not idealized—parameters:
- Satellite transmit: 50 W (47 dBW)
- Transmit antenna gain: 34 dBi
- Range: 38,500 km (GEO)
- Receive antenna gain: 42 dBi (1.8 m dish)
- System noise temp: 85 K (cryogenic LNA)
- Bandwidth: 36 MHz
Step 1: Calculate Free-Space Path Loss
Lpath = 20×log₁₀(4πd/λ). λ = c/f = 0.02564 m.
Lpath comes out to roughly 205.5 dB.
Step 2: Calculate Received Signal Power
Preceived = 47 + 34 + 42 - 205.5 = -82.5 dBW = -52.5 dBm
Step 3: Calculate Noise Power
Pnoise = kTB. Plug in the numbers and you get about -133.7 dBm for your 36 MHz bandwidth.
Step 4: Calculate SNR
SNR = -52.5 dBm - (-133.7 dBm) = 81.2 dB.
This is a lot of margin, and explains why ground stations can use high-order modulations if their front-end is built right. Cryogenic cooling alone can add more than 10 dB to your SNR, which pays off if you’re pushing data rates.
If you skip the cryostat and run at roughly 300 K system noise, SNR drops to around 75.7 dB. Still impressive, but you lose options up at the high end of modulation schemes and need stronger FEC.
Step 5: Link Margin Analysis
Say your target for 32-APSK at practical error rates is 16 dB SNR. That leaves a margin of 65 dB after accounting for path losses and potential weather issues. This excess can be cashed in by reducing power, shrinking antennas, or upgrading modulation—and that’s what’s usually done when budgets are tight or channel conditions are stable.
Applications in Control Systems and Robotics
SNR isn’t just for RF—practical linear actuator and robot designs run into it, too. If you need an encoder to resolve positions down to 0.01 mm, you’ll want at least 20 dB SNR at the threshold where pulses must be cleanly separated from noise, especially with electrical garbage from motor drivers around. If you’re weighing with a load cell (say, 0.1 kg resolution on a 100 kg cell), you’re aiming for a 60 dB ratio. When cables run near switching drives, common-mode noise can swamp your readings unless your front-end offers high rejection (80-100 dB CMRR is used for a reason in these cases).
Temporal Averaging and Processing Gain
Averaging repeated measurements improves SNR, but only to a point. If your noise is white and uncorrelated, SNR increases as the square root of the number of samples—so 10,000 averages brings a 20 dB improvement. Boxcar averaging, moving averages, and lock-in detection all use this trick. Slow loops can afford this, fast control usually can’t, and it’s a waste of time if your noise is mostly 1/f or deterministic pickup—you’ll never get the full benefit unless you deal with those at the source.
Basically, filter or reject the right noise, and then average. If you don’t, you’re just averaging garbage and the SNR doesn’t get any better.
Frequently Asked Questions
Free Engineering Calculators
Explore our complete library of free engineering and physics calculators.
Browse All Calculators →🔗 Explore More Free Engineering Calculators
- I2C/SPI Bus Speed & Pull-up Resistor Sizing
- LED Resistor Calculator — Current Limiting
- Low-Pass RC Filter Calculator — Cutoff Frequency
- Capacitor Charge Discharge Calculator — RC Circuit
- Crossover Calculator
- Capacitive Transformerless Power Supply Calculator
- Skin Depth Calculator
- Transformer Turns Ratio Calculator
- Voltage Divider Calculator
- Ohm's Law Calculator — V I R P
About the Author
Robbie Dickson — Chief Engineer & Founder, FIRGELLI Automations
Robbie Dickson brings over two decades of engineering expertise to FIRGELLI Automations. With a distinguished career at Rolls-Royce, BMW, and Ford, he has deep expertise in mechanical systems, actuator technology, and precision engineering.
Video Walkthrough - How to Use This Calculator
Need to implement these calculations?
Explore the precision-engineered motion control solutions used by top engineers.


