If you want to know what your line can really output—or justify buying another machine—you need hard numbers. This Production Rate Units/Hour Calculator will give you practical values for production rates, cycle times, hours needed to meet target, machine counts, total output, and OEE. It works for any job where throughput has a direct effect on cost and delivery: automotive, electronics, pharma, or any high-volume setup. You'll find the working formulas, a concrete example, theory, and a detailed FAQ below.
What is production rate?
Production rate is simply the number of units your process finishes in a given time—usually in units per hour. It’s your basic measure of how fast you’re producing and if you have enough capacity to keep up.
Simple Explanation
Think of a car wash: run 60 cars through in one hour, and your production rate is 60 cars/hour. If sales push you to 90 cars an hour, you’ll need to pick up speed or add a second wash bay. It works exactly the same way in a factory: higher output in the same time means a higher rate, and knowing your rate makes it clear what you can deliver and what resources you’ll need.
📐 Browse all 1000+ Interactive Calculators
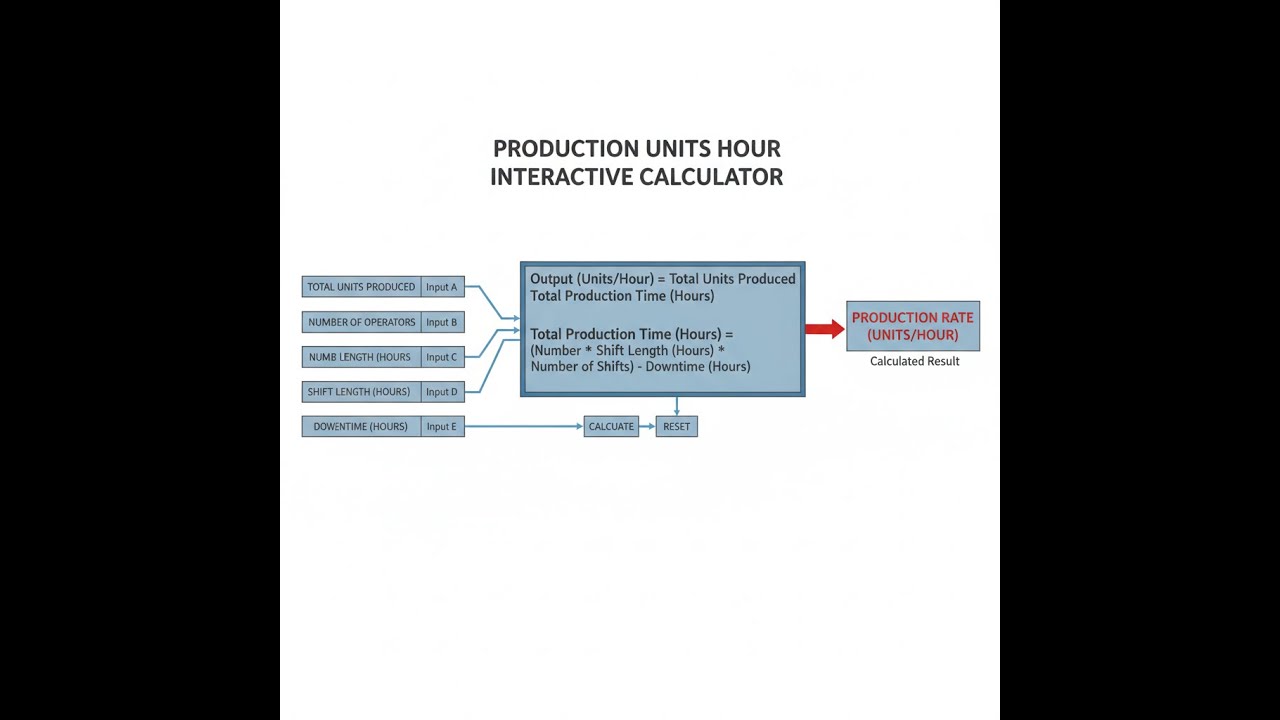
Production Rate System Diagram

Production Rate Calculator
How to Use This Calculator
This calculator is intended for education, concept evaluation, and preliminary design. Results are based on the equations and assumptions described on this page, but cannot account for every real-world load case, tolerance, material property, environmental condition, installation detail, safety factor, code, or regulatory requirement. Verify all inputs, assumptions, units, and results independently before selecting components or using the result in a real application. Safety-critical, structural, medical, lifting, transportation, or regulated applications must be reviewed by a qualified engineer.
Questions about this calculator or found an error? Message our engineering team.
- Select your calculation mode from the dropdown — choose from production rate, cycle time, required hours, machine count, total output, or OEE.
- Enter the values for your chosen mode — for example, units produced and time period, or target units and efficiency factor.
- Adjust any optional fields such as efficiency factor or time unit for cycle time results.
- Click Calculate to see your result.
Production Rate Units/Hour Interactive Visualizer
Calculate production rate, cycle time, and efficiency metrics for manufacturing operations. Visualize how units per hour drives capacity planning and output targets across assembly lines.
PRODUCTION RATE
100 u/h
CYCLE TIME
36.0 sec
EFFECTIVE RATE
85 u/h
DAILY OUTPUT
2040 units
FIRGELLI Automations — Interactive Engineering Calculators
Production Rate Equations
Here's the direct formula for production rate.
Basic Production Rate
R = N / T
Where:
R = Production rate (units/hour)
N = Number of units produced (units)
T = Time period (hours)
For cycle time, use the formula below.
Cycle Time
Ct = 3600 / R
Where:
Ct = Cycle time per unit (seconds/unit)
R = Production rate (units/hour)
3600 = Seconds per hour conversion factor
Use the formula below for required hours.
Required Production Hours
Treq = Ntarget / (R × E)
Where:
Treq = Required production hours (hours)
Ntarget = Target units to produce (units)
R = Production rate (units/hour)
E = Efficiency factor (0 to 1, dimensionless)
Use this to get the correct machine quantity.
Number of Machines Required
M = ⌈Ntarget / (Rmachine × Tavailable)⌉
Where:
M = Number of machines required (rounded up to whole number)
Ntarget = Target units to produce (units)
Rmachine = Rate per machine (units/hour)
Tavailable = Available production time (hours)
⌈ ⌉ = Ceiling function (round up)
Total output comes from this formula.
Total Production Output
Ntotal = M × Rmachine × Toperating
Where:
Ntotal = Total production output (units)
M = Number of machines (dimensionless)
Rmachine = Rate per machine (units/hour)
Toperating = Operating time (hours)
For OEE, use the formula below.
Overall Equipment Effectiveness (OEE)
OEE = A × P × Q × 100%
Where:
OEE = Overall Equipment Effectiveness (%)
A = Availability = Nactual / (Rideal × Tplanned)
P = Performance = Nactual / (Rideal × Tplanned)
Q = Quality = Ngood / Nactual
Nactual = Actual units produced (units)
Ngood = Good quality units (units)
Rideal = Ideal production rate (units/hour)
Tplanned = Planned production time (hours)
Simple Example
A line puts out 500 units in an 8-hour shift.
Production rate = 500 / 8 = 62.5 units/hour
Cycle time = 3600 / 62.5 = 57.6 seconds/unit
To hit 3,000 units at 85% efficiency: 3000 / (62.5 × 0.85) = 56.5 hours required
Theory & Engineering Applications
Production rate is the starting point for most manufacturing and capacity planning. If you don’t know actual output per hour, you can’t forecast, allocate labor, spot bottlenecks, or even set honest delivery timelines. The same math applies in every high-volume field, whether you’re assembling cars, packaging pills, or making potato chips.
Fundamental Production Rate Theory
Production rate is just throughput—units out per unit of time. The calculation itself (output divided by time) is simple, but making it useful means accounting for real-world details: downtime, variable cycle times, changeovers, and quality defects. The gap between the ideal (maximum) and what actually comes off the line points straight to your biggest process losses.
Cycle time is the other side of the coin: time to make a single unit. If you track even a handful of seconds gained or lost, you’ll see big swings in your total shift output. Cycle time matters most when everything’s running in sync—one operation running slow can back up an entire line.
Takt Time vs. Cycle Time: A Critical Distinction
People often confuse takt time and cycle time. Takt time sets your pace: it’s the available production time divided by how many units customers need. For example, if you have 28,800 seconds in the day and need to ship 576 units, takt time is 50 seconds/unit. Cycle time is what’s actually happening on the floor. If cycle time is above your takt time, you're not going to hit customer demand unless you overtime or add lines. Matching your average cycle time to takt time is central to running lean—undershooting wastes money, overshooting means you miss orders.
Overall Equipment Effectiveness (OEE)
OEE combines availability (uptime), performance (speed), and quality (good output). Calculate each, then multiply. So if you’re up 90% of the time, running at 95% of rated speed, and make 98% good units, your OEE is 83.8%. Most factories see 60-70%; top-tier lines can top 85%. Small losses multiply: losing 5% in each area means you lose more than 15% total, not just a simple sum, so any one area can drag the whole number down.
Improving one factor only gets you so far; focus on all three for real, lasting improvement. That means tracking not just breakdowns, but slow cycles and scrap too.
Multi-Machine Production Systems
Machine quantity calculations use ceiling functions because you can’t buy half a machine. If the math says you need 3.2 machines, you buy 4. That “extra” bit gives you a cushion for maintenance or unexpected demand. Divide your needed rate by what you can get from each machine, then plan for one more than the math usually suggests if you want any slack. Real-world, total output across identical machines can run 85-95% of the sum, since shared labor, materials, or controls can hold them up.
Production Rate Variability and Buffer Sizing
Every production process shows some cycle time variation—no way around it—which creates headaches for scheduling and inventory. Variability is measured as the coefficient of variation: standard deviation over mean. The higher it is, the more buffer (extra stock between steps) you need so the next process doesn’t run dry. Above 80-85% utilization, variability starts to hurt a lot, and waiting and inventory pile up fast. So even if the paper rate is 100 units/hour, you’ll probably hit only 80-85 actual unless everything’s running flat out with little disruption. Building in a 15-25% safety margin is normal practice for planners.
Worked Example: Complete Production Planning Analysis
Let’s say a circuit board factory projects an order for 12,000 units a month. Two 8-hour shifts, 5 days a week, about 22 days per month. A 4-hour pilot run makes 47 units, 3 of which are bad.
Step 1: Pilot production rate
47 units / 4 hours = 11.75 units/hour. Quality = (47 - 3) / 47 = 93.6%. Good unit rate = 11.75 × 0.936 = 11.00 units/hour.
Step 2: Monthly capacity need
Available time: 22 × 16 = 352 hours. Needed rate: 12,000 / 352 = 34.09 units/hour. If yield is 93.6% good, need 34.09 / 0.936 = 36.43 units/hour gross.
Step 3: Machines needed
36.43 needed / 11.75 per machine = 3.10, so you buy 4. Utilization: 3.10 / 4 = 77.5% use.
Step 4: Real output and OEE
4 machines × 11.00 good/hr × 352 hr = 15,488 good units/month. Buffer = 15,488 - 12,000 = 3,488 units, or 29.1% margin. If you figure in 85% uptime for maintenance, 15,488 × 0.85 = 13,165/month. OEE is 85% × 77.5% × 93.6% = 61.6%.
Step 5: How to improve
You want to get to world-class (OEE 85%). Raise yield to 98%: gains 4.4%. Increase uptime to 90%: gains 5%. Reduce cycle time by about 4%: gains 4%. Add them up, and you could make 17,250/month without buying more hardware.
This approach shows buying four machines at 77.5% use easily covers the order with real-world slack. OEE of 61.6% means there’s a lot of room to improve before you’d ever need more machines.
Industry-Specific Applications
In auto plants, assembly speed is set by the takt time, usually 45–90 seconds per vehicle. Every station must keep up with this pulse or the whole plant falls behind. A station running over takt becomes the main bottleneck.
Pharma plants run mostly in batch, not continuous flow. Setup time, batch testing, cleaning, and holding all eat into your hourly rate. For example, a tablet press might hit 300,000/hr in pure run, but after you factor in changeovers and cleaning downtime, the monthly average may drop to 180,000/hr.
Semiconductor fabs are at the other extreme: machines are extremely expensive and cycle times are long (sometimes hours or days). Planners use metrics like wafer starts per week and must factor in scheduled downtime—often running overall availability at just 75-85%.
For more manufacturing and quality calculators, visit our engineering calculator library.
Practical Applications
Scenario: Contract Manufacturing Capacity Decision
Jennifer, running operations for a contract electronics manufacturer, gets an RFQ for 45,000 assemblies due in three months. Her pilot ran 127 units in 8 hours with 3 defects. Plugging values into the "Required Machines" mode with 15,000/month, 352 hours available (22 days at 16 hours each), and 15.5 good units/hour per machine, she gets 2.75 machines needed. With only 2 in house, she’ll need to add one more to confidently meet the order, factoring in downtime and keeping quality up to standard.
Scenario: Production Shift Planning for Seasonal Demand
Marcus, a scheduler at a toy plant, has to hit 125,000 bodies before November (12 weeks out). Six molding machines, each at 142/hr, and historical OEE is 78%. Using "Required Hours" with the real efficiency, he gets 188.3 hours needed. Spread over 12 weeks, that’s 15.7 hours/week—plenty of buffer, so he can slot in maintenance or run shorter shifts rather than push overtime or risk breakdowns.
Scenario: Process Improvement ROI Analysis
Dr. Chen, overseeing pharma packaging, runs 14,850 bottles per 20-hour day with 780 rejections. A $180k filler upgrade is proposed to cut cycle time by 8% and halve defects. Calculator says her current OEE is 87.9%. With the new system (faster cycle and fewer rejects), OEE would be 97.8%. Output rises 11.2% per day (15,648 vs 14,070 good units). Run 250 days/year, at $8.50 margin each, the investment pays for itself in just over 6 weeks. The calculator turns the improvement into real dollar terms for the business case.
Frequently Asked Questions
▼ What's the difference between production rate and cycle time, and when should I use each?
▼ Why do my actual production results always fall short of calculated rates, and how should I account for this?
▼ How do I determine the optimal number of machines versus running existing machines longer hours?
▼ What's a realistic target for OEE, and how do I improve it systematically?
▼ How should I handle production rate calculations when products have different cycle times on the same equipment?
▼ What's the relationship between production rate and staffing requirements?
Free Engineering Calculators
Explore our complete library of free engineering and physics calculators.
Browse All Calculators →🔗 Explore More Free Engineering Calculators
About the Author
Robbie Dickson — Chief Engineer & Founder, FIRGELLI Automations
Robbie Dickson brings over two decades of engineering expertise to FIRGELLI Automations. With a distinguished career at Rolls-Royce, BMW, and Ford, he has deep expertise in mechanical systems, actuator technology, and precision engineering.
Video Walkthrough - How to Use This Calculator
Need to implement these calculations?
Explore the precision-engineered motion control solutions used by top engineers.


