Knowing your inventory turnover ratio isn't the end of the story—acting on it is what actually changes your cash flow. If you've got slow-moving stock, every extra day ties up money you could use elsewhere, not to mention extra storage and the chance things become obsolete. The calculator below lets you plug in real figures for cost of goods sold (COGS) and average inventory to see turnover ratio, Days Inventory Outstanding (DIO), and related calculations. This is relevant whether you’re in manufacturing, distribution, or retail—anywhere inventory velocity impacts cash on hand and day-to-day operations. On this page you’ll find core formulas, a worked example, the reasoning behind the COGS-based approach, and a practical FAQ.
What is Inventory Turnover?
Inventory turnover simply tells you how often a business sells and replaces its stock in a set period. High turnover means you’re moving product quickly; low turnover means your money sits in inventory, not working for you.
Simple Explanation
Picture a grocery store shelf. If you restock and sell out six times in a year, that's a turnover of 6. The more often you move product off that shelf and sell it, the less cash you have stuck in unsold goods. Slow turns mean money locked up, not available for other uses.
📐 Browse all 1000+ Interactive Calculators
Table of Contents
How to Use This Calculator
- Pick what you want to solve for in the dropdown—turnover ratio, target COGS, inventory needed, etc.
- Enter your Cost of Goods Sold for the period (usually annual).
- Enter your Average Inventory value, which is typically (Beginning Inventory + Ending Inventory) ÷ 2.
- Click Calculate for the result.
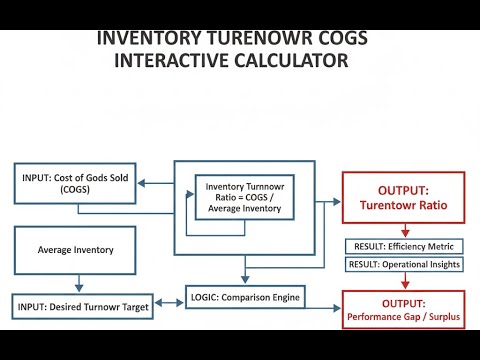
Visual Diagram

Inventory Turnover Calculator
This calculator is intended for education, concept evaluation, and preliminary design. Results are based on the equations and assumptions described on this page, but cannot account for every real-world load case, tolerance, material property, environmental condition, installation detail, safety factor, code, or regulatory requirement. Verify all inputs, assumptions, units, and results independently before selecting components or using the result in a real application. Safety-critical, structural, medical, lifting, transportation, or regulated applications must be reviewed by a qualified engineer.
Questions about this calculator or found an error? Message our engineering team.
Inventory Turnover COGS Interactive Visualizer
You can see directly how changes to COGS or inventory alter turnover ratio, days of inventory on hand, and impacts on cash flow. Move the sliders to model adjustments and see what happens to your capital tied up in inventory.
TURNOVER RATIO
6.0x
DAYS OUTSTANDING
60.8 days
DAILY COGS
$1,644
FIRGELLI Automations — Interactive Engineering Calculators
Core Equations
The main formula for turnover ratio is straightforward.
Inventory Turnover Ratio
Turnover = COGS / Average Inventory
Where:
• COGS = Cost of Goods Sold for the period (currency units)
• Average Inventory = (Beginning Inventory + Ending Inventory) / 2 (currency units)
• Turnover = Number of times inventory is sold and replaced (dimensionless)
DIO is also simple—here’s the equation.
Days Inventory Outstanding (DIO)
DIO = Period (days) / Turnover Ratio
Alternatively:
DIO = (Average Inventory / COGS) × Period (days)
Where:
• DIO = Days Inventory Outstanding (days)
• Period = Analysis period, typically 365 days for annual calculations
This gives you required inventory for a specific turnover target.
Required Inventory for Target Turnover
Average Inventory = COGS / Target Turnover
Where:
• Average Inventory = Required average inventory value (currency units)
• Target Turnover = Desired turnover ratio (times per period)
And this is for working backwards to find what sales volume you need for a goal turnover.
Required COGS for Target Turnover
COGS = Target Turnover × Average Inventory
Where:
• COGS = Required Cost of Goods Sold to achieve target (currency units)
• This equation determines sales volume needed for desired inventory efficiency
Simple Example
If a distributor logs $600,000 in annual COGS with $100,000 average inventory:
- Turnover = $600,000 / $100,000 = 6.0x
- DIO = 365 / 6.0 = 60.8 days
- To hit 8x turnover: required inventory = $600,000 / 8 = $75,000
Theory & Engineering Applications
Inventory turnover, when measured using COGS, gives a realistic look at how quickly inventory gets converted into cash. Revenue-based turnover can be skewed by markup and doesn’t reflect actual product flow. Using COGS removes that distortion. You end up with a number that tells you how much of your real input cost is leaving the shelves and returning as cash—critical for both operations and finance.
Fundamental Theory and Financial Mechanics
Inventory turnover ratio is just annual COGS divided by average inventory. Most people use the average from beginning and end of period, but you can use better data if you have it. This ratio is a direct read on how often you’re wiping the shelves clean and refilling, which cuts down on both holding costs and risk. For example, a turnover of 6 means you replace your inventory roughly every two months.
Turnover lines up with DIO (Days Inventory Outstanding): Ratio shows frequency; DIO shows how long your current inventory would last at your recent sales rate. The math is simple and the relationship is inverse—faster turnover means fewer days of inventory hanging around. This dual readout helps managers see the situation as both “how often” and “for how long.” Use whichever is more practical for your decisions.
One common pitfall: turnover changes depending how you count inventory. FIFO, LIFO, or how much overhead you roll into inventory can swing your reported ratio by a lot, sometimes 15–30%. If you benchmark, make sure everyone is comparing apples to apples—same accounting, same valuation methods, or you’re just chasing ghosts. Also, remember that a “better” ratio on paper may not reflect actual operational improvements if it’s just accounting changes.
Industry Benchmarks and Performance Standards
What counts as “good” for inventory turnover heavily depends on your line of work. Perishable or quick-moving products (like groceries) hit 12 or more turns a year. Fast-fashion might target 10-12. On the other end, industrial or aerospace products may only turn 2-4 times due to long production cycles and expensive parts. Don’t expect to boost heavy industrial turnover to supermarket rates; focus on what actually makes sense for your materials, lead times, and demand pattern.
Some industries face outside limits: for example, pharma companies keep more finished goods around for regulatory or quality reasons, which drags turnover down versus other sectors. In these cases, the goal isn’t about chasing a high number, but finding what meets all operational and regulatory needs without tying up unnecessary capital.
Working Capital Implications and Cash Flow Management
Every time you increase your turnover ratio, you keep less money stuck in inventory. That reduces the window between cash going out to suppliers and coming back in from customers. If you can bump turnover, you often free up more working capital than you'd expect: for instance, a manufacturer that improves from 5x to 6x turnover on $10 million COGS goes from $2 million to $1.67 million in inventory, freeing $330,000. If your cost of capital is 10%, that’s $33,000 in annual savings before you even look at physical storage or shrinkage costs.
This gets even more important during periods of sales growth—if turnover doesn’t improve, you have to cough up the extra cash to build up inventory as business expands. But if you can increase turnover, you might fund the growth mostly with what you’ve already got on hand, rather than needing outside financing.
Comprehensive Worked Example: Manufacturing Optimization
Scenario: Precision Components Inc. wants to get more out of its warehouse and working capital, looking at three product lines with different turnover rates, plus company-wide overhead and storage cost.
Given Data:
- Product Line A: Annual COGS = $3,250,000, Beginning Inventory = $425,000, Ending Inventory = $495,000
- Product Line B: Annual COGS = $1,820,000, Beginning Inventory = $310,000, Ending Inventory = $270,000
- Product Line C: Annual COGS = $2,140,000, Beginning Inventory = $580,000, Ending Inventory = $620,000
- Company-wide overhead and storage costs: $185,000 annually
- Cost of capital: 12% annually
- Target consolidated turnover ratio: 7.5x
Step 1: Calculate Average Inventory for Each Product Line
Product Line A: ($425,000 + $495,000) / 2 = $460,000
Product Line B: ($310,000 + $270,000) / 2 = $290,000
Product Line C: ($580,000 + $620,000) / 2 = $600,000
Step 2: Calculate Current Turnover Ratios
Product Line A: $3,250,000 / $460,000 = 7.07x
Product Line B: $1,820,000 / $290,000 = 6.28x
Product Line C: $2,140,000 / $600,000 = 3.57x
Step 3: Calculate Current DIO
Product Line A: 365 / 7.07 = 51.6 days
Product Line B: 365 / 6.28 = 58.1 days
Product Line C: 365 / 3.57 = 102.2 days
Step 4: Consolidate Company-wide
Total COGS = $7,210,000; Total Inventory = $1,350,000; Consolidated Turnover = 5.34x; DIO = 68.4 days
Step 5: Reduction Needed for 7.5x Consolidation
$7,210,000 / 7.5 = $961,333 (target average inventory)
1,350,000 – 961,333 = $388,667 (inventory must come down by this much)
Step 6: What’s That Worth?
Releasing $388,667 in capital saves $46,640/yr at 12% cost of capital, plus a proportional storage cost reduction of $53,256, totaling about $99,896 per year.
Step 7: Find the Bottleneck
Line C is the problem: 3.57x (102 days). If you cut its inventory to around $401,000, you’d bring it up closer to the company average. That's a 33% cut—but you’d look for ways to do this sensibly: more accurate forecasts, smaller batch sizes, or shorter supplier lead times. Line A is already over target, so you might actually increase its inventory a bit to prevent outages on fast movers. The main opportunity is getting Line C under control.
Interpretation: Product Line C holds too much inventory. Fixing that achieves the company’s turnover goal and unlocks nearly $390,000 for the rest of the business, without disrupting areas that are already efficient. It’s practical to focus inventory reduction efforts on slow lines rather than squeezing high performers further.
Advanced Applications in Supply Chain Optimization
Turnover is a core indicator for overall supply chain health. JIT (Just-in-Time) manufacturing aims for the highest possible turns by making and moving products only when needed. For example, Toyota can push 50+ turns per year by producing to real orders with tightly controlled inbound logistics, but this leaves little margin for disruption; when supply hiccups hit, the whole operation feels it immediately.
Real-world events like COVID-19 showed the downsides of “just chase the highest possible turnover.” Many firms that minimized inventory as much as possible found themselves out of stock when events outside their control pinned down shipments. Now, many companies are purposefully relaxing their targets a bit, trading off some extra inventory for more resilience. In these cases it becomes a deliberate risk-management choice, not a contest for the highest possible turnover.
If you run a multi-layer supply chain, like distribution centers feeding different stores, expect turnover to vary by location. Distribution hubs run with lower turnover (higher on-hand) to buffer for all outlets; retail stores might turn faster. Software can help optimize targets at each layer—but always check the math and assumptions against reality on your warehouse floors.
Inventory Turnover in Lean and Six Sigma Methodologies
In Lean Manufacturing, turnover is a quick diagnostic for finding waste. Low turnover means you’re storing too much—capital sitting in bins, not contributing anything. Value Stream Mapping helps pinpoint where inventory piles up within a process, showing where work stalls before moving forward. If raw materials turn 12 times a year but finished goods turn 4, you've probably got a choke point mid-process.
Six Sigma projects use turnover within their measure-analyze-improve cycles. Start by establishing current performance, then dig into which parts of the business lag on turnover—this could involve looking at particular SKUs, suppliers, or time periods. Targeted improvements—smaller batches, fewer setups, better supplier terms—can raise the ratio steadily. Use control charts to watch for backsliding.
Theory of Constraints (TOC) is another useful lens. Low turnover in one spot (or high inventory quote-days sitting somewhere specific) often means you’ve found your bottleneck. Direct improvement efforts where the system truly chokes, not just across the board. Inventory often stacks up before a slow process, not spread evenly through the plant.
Technology Integration and Real-Time Turnover Management
Modern ERP and warehouse management systems give you turnover no longer just company-wide, but broken down to individual SKUs, suppliers, even shelf locations. This lets you tackle the specific areas really dragging on your efficiency. You might discover turnover swings hard seasonally, so it's smart to measure and target by time period, not just annualized averages.
RFID and IoT take this a step further, automatically tracking item-level inventory in real time. You’ll spot which sizes, colors, or SKUs are flying out while others collect dust. If your overall turnover looks good but a subset is chronically slow or fast, act accordingly—don’t just focus on averages.
Machine learning and AI can now forecast turnover trends based on history, seasonality, and even outside influences. This helps you see trouble coming and act on it, rather than doing everything after the fact.
Practical Applications
Scenario: Electronics Distributor Optimizing Cash Flow
Marcus, the CFO of a regional electronics distributor, is under pressure to get more cash flowing without hurting service. His current numbers: $18.5M COGS, $3.7M inventory, giving a 5.0x turnover. He wants to try for 6.5x—plugging that in, inventory could come down to $2.85M, unlocking $850K. Saving at a 9% cost of capital, he'd get $76,500 a year—just about covering what a new inventory management system would cost. He uses these calculations to build a straight-up argument for investing in the upgrade.
Scenario: Manufacturing Plant Benchmarking Performance
Angela runs continuous improvement at an automotive parts plant. Corporate HQ wants inventories down. Plant numbers: $42.3M COGS, $9.4M inventory, which is a 4.5x turnover (81 days). The boss wants 60 days max. Using optimal inventory mode, Angela sees she’d need inventory at $6.95M for that—26% less. Rather than just accepting it as a command, she checks what that means for turnover ratio (7.08x), then looks up best-in-class industry rates (8–10x). She proposes a phased plan to get to 6x, then 7.5x, showing how much working capital would be freed at each step—providing a practical, evidence-driven plan instead of a blanket cut.
Scenario: Retail Chain Seasonal Planning
David manages inventory planning for a home goods retailer that does 40% of its sales in Q4. Last year, Q4 COGS was $127M, inventory $31.2M, which is only 4.07x—leaving a pile of slow sellers at year end. This year he uses the calculator, targets 5.5x, and finds inventory should average $23.1M. That means starting Q4 leaner at $19M, not $28M, and tightening up vendor replenishment instead of sitting on old stock. By improving turnover (DIO drops to 66 from 90), he frees $8M in working capital, which can be used elsewhere in the business—especially for handling markdowns or responding fast to demand spikes.
Frequently Asked Questions
▶ What is a good inventory turnover ratio?
▶ How do I calculate average inventory accurately?
▶ Should I include all inventory categories in turnover calculations?
▶ How does inventory valuation method affect turnover calculations?
▶ Can inventory turnover be too high?
▶ How do I improve inventory turnover without harming operations?
Free Engineering Calculators
Explore our complete library of free engineering and physics calculators.
Browse All Calculators →🔗 Explore More Free Engineering Calculators
About the Author
Robbie Dickson — Chief Engineer & Founder, FIRGELLI Automations
Robbie Dickson brings over two decades of engineering expertise to FIRGELLI Automations. With a distinguished career at Rolls-Royce, BMW, and Ford, he has deep expertise in mechanical systems, actuator technology, and precision engineering.
Video Walkthrough - How to Use This Calculator
Need to implement these calculations?
Explore the precision-engineered motion control solutions used by top engineers.


