Choosing whether a project is worth funding comes down to one number — does it return more than it costs, accounting for when those returns arrive? Use this Benefit Cost Ratio Calculator to calculate the BCR using total benefits, total costs, discount rate, and project life across 6 calculation modes. It's a core decision tool in infrastructure planning, manufacturing capital budgeting, and environmental engineering. This page includes the BCR formula, a worked example, full theory, and a detailed FAQ.
What is Benefit Cost Ratio?
The Benefit Cost Ratio (BCR) is a number that tells you how much value you get back for every dollar you spend on a project. A BCR above 1.0 means benefits outweigh costs — the project is worth doing. Below 1.0, costs exceed benefits — it isn't.
Simple Explanation
Think of BCR like a return on a bet: if you spend $100 and get $150 back, your BCR is 1.5 — a good deal. If you only get $80 back, your BCR is 0.8 — a bad deal. The twist is that money arriving years from now is worth less than money today, so BCR analysis adjusts for that using a discount rate, the same way you'd rather have $100 today than a promise of $100 in 10 years.
📐 Browse all 1000+ Interactive Calculators
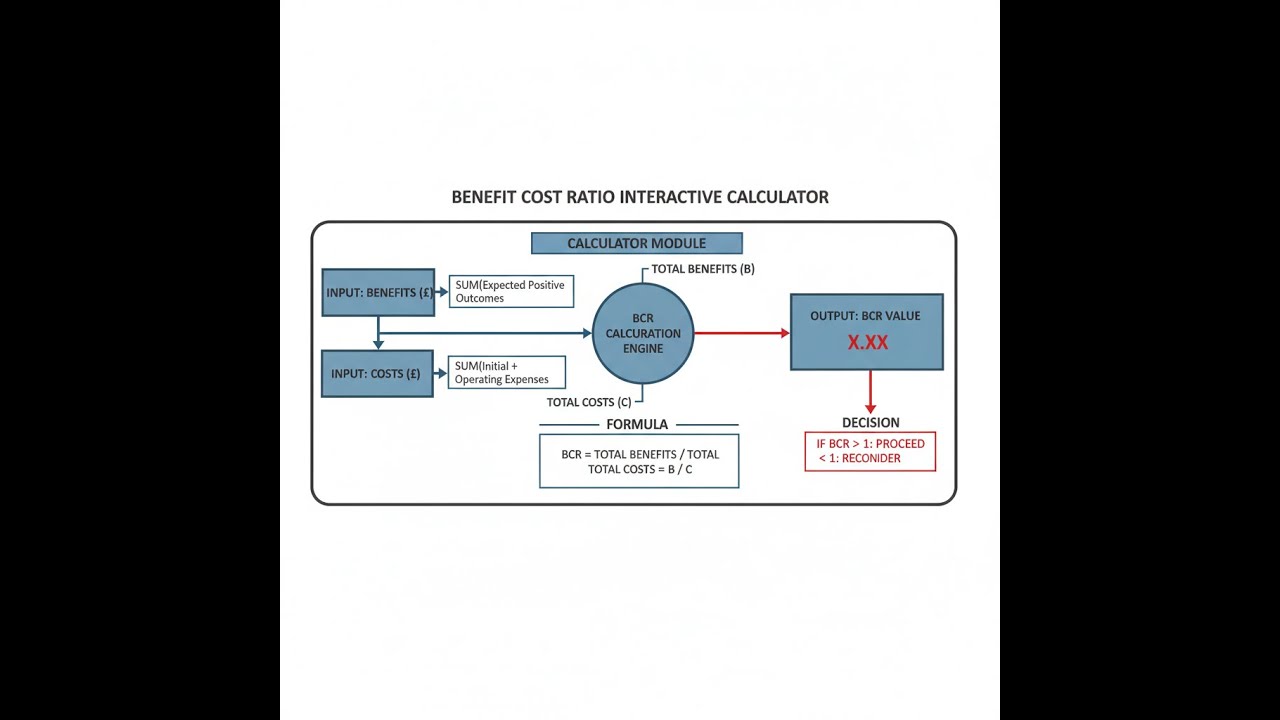
Visual Diagram

Benefit Cost Ratio Calculator
How to Use This Calculator
- Select your Calculation Mode from the dropdown — choose Basic BCR for a simple ratio, or Present Value mode if you're working with multi-year cash flows and a discount rate.
- Enter your benefit and cost values in the input fields that appear for your selected mode.
- If using Present Value or Break-Even mode, also enter your Project Life (years) and Discount Rate (%).
- Click Calculate to see your result.
Benefit Cost Ratio Interactive Visualizer
See how benefit cost ratio changes with project parameters in real-time. Watch the visual breakdown of benefits vs costs and understand when projects become economically viable.
BCR
1.67
NET BENEFIT
$200K
DECISION
ACCEPT
FIRGELLI Automations — Interactive Engineering Calculators
Key Equations
Use the formula below to calculate the Benefit Cost Ratio.
Basic Benefit Cost Ratio
Where:
- BCR = Benefit Cost Ratio (dimensionless)
- B = Total Benefits ($)
- C = Total Costs ($)
Present Value BCR
Where:
- PV(Benefits) = Present Value of all future benefits ($)
- PV(Costs) = Present Value of initial investment plus operating costs ($)
Present Value Calculation
Where:
- CFt = Cash flow in year t ($/year)
- r = Discount rate (decimal)
- t = Time period (years)
Net Benefit
Where:
- NB = Net Benefit ($)
- B = Total Benefits ($)
- C = Total Costs ($)
Incremental BCR
Where:
- BB = Benefits of Project B ($)
- BA = Benefits of Project A ($)
- CB = Costs of Project B ($)
- CA = Costs of Project A ($)
Decision Criteria
- BCR > 1.0: Benefits exceed costs → Accept project
- BCR = 1.0: Benefits equal costs → Break-even (marginal)
- BCR < 1.0: Costs exceed benefits → Reject project
Simple Example
A facility spends $200,000 on a process upgrade that returns $300,000 in savings over its life.
- Total Benefits: $300,000
- Total Costs: $200,000
- BCR = $300,000 / $200,000 = 1.50
- Result: BCR > 1.0 — project is economically viable. Every dollar spent returns $1.50.
Theory & Engineering Applications
The Benefit Cost Ratio emerged from water resource engineering in the early 20th century and became formalized through the U.S. Flood Control Act of 1936, which mandated that federal water projects could proceed only if "the benefits to whomsoever they accrue exceed the estimated costs." This principle evolved into the systematic BCR methodology now applied across infrastructure, manufacturing, environmental engineering, and technology sectors.
Theoretical Foundation and Economic Principles
BCR analysis rests on the principle of opportunity cost and time value of money. Unlike simple payback period calculations, BCR accounts for the temporal distribution of cash flows through discounting, recognizing that a dollar received today has greater economic value than a dollar received in future years. The discount rate selection becomes critical—typically ranging from 3-7% for public infrastructure projects and 8-15% for private sector investments, reflecting organizational cost of capital and risk profiles.
A non-obvious limitation: BCR does not account for project scale. Consider two projects: Project X with BCR of 3.5, benefits of $350,000, and costs of $100,000 versus Project Y with BCR of 2.0, benefits of $10 million, and costs of $5 million. While Project X shows superior ratio performance, Project Y generates $9.65 million more in absolute net benefit. This paradox requires engineers to evaluate BCR alongside Net Present Value (NPV) and Internal Rate of Return (IRR) when comparing mutually exclusive alternatives with different investment magnitudes.
Present Value Discounting Mechanics
The discount factor (1 + r)-t exponentially reduces future cash flows. For a 5% discount rate over 20 years, a benefit realized in year 20 is worth only 37.7% of its nominal value. This mathematical reality profoundly impacts long-term infrastructure projects like bridges, water treatment facilities, and renewable energy installations where benefits accrue over decades. Engineers must carefully estimate benefit streams—considering degradation, maintenance cycles, and technological obsolescence—to avoid systematic overestimation that produces artificially inflated BCRs.
The choice between constant versus variable discount rates introduces additional complexity. Declining discount rate schedules (e.g., 3.5% for years 1-30, reducing to 3.0% for years 31-60) better reflect intergenerational equity concerns in climate change mitigation projects and environmental remediation, where distant future benefits carry greater ethical weight than traditional exponential discounting suggests.
Incremental Analysis in Comparative Evaluation
When selecting between mutually exclusive alternatives, incremental BCR analysis provides rigorous decision logic. The methodology compares the incremental benefits gained from choosing a more expensive alternative against its incremental costs. A common engineering error involves selecting the project with highest individual BCR rather than conducting proper incremental analysis. The correct procedure ranks projects by increasing cost, then evaluates each increment sequentially—accepting increments with BCR > 1.0 until budget constraints or declining incremental returns appear.
Industry-Specific Applications
In civil infrastructure, BCR evaluates highway expansion projects by quantifying travel time savings, accident reduction, and vehicle operating cost improvements against construction and maintenance expenditures. The American Association of State Highway and Transportation Officials (AASHTO) provides standardized methodologies for monetizing safety benefits at approximately $11.8 million per statistical life saved and time savings at occupation-weighted wage rates.
Manufacturing automation projects use BCR to justify robotics and process control investments. Benefits include reduced labor costs, improved quality (quantified through reduced scrap and rework), increased throughput, and enhanced workplace safety. A critical consideration: automation benefits often plateau after initial efficiency gains, while software maintenance costs and technology refresh cycles create ongoing cost streams that must be accurately modeled in BCR calculations.
Environmental engineering applies BCR to pollution control, remediation, and sustainability initiatives. The U.S. Environmental Protection Agency's regulatory impact analyses employ BCR to assess proposed standards, monetizing health benefits through reduced mortality, morbidity, and lost productivity. These calculations involve significant epistemic uncertainty—the value of a statistical life year ranges from $100,000 to $500,000 depending on methodology, while ecosystem service valuations rely on contingent valuation surveys with inherent measurement challenges.
Energy sector BCR evaluations compare renewable installations against conventional generation. Solar photovoltaic arrays demonstrate improving BCRs as module costs decline (reaching $0.20/watt in 2024 versus $4.00/watt in 2008), while levelized cost of energy (LCOE) decreases enable BCRs exceeding 2.0 in high-insolation regions when carbon externalities are monetized at $50-$150 per metric ton CO₂ equivalent.
Comprehensive Worked Example: Industrial Wastewater Treatment System
A chemical manufacturing facility evaluates installing an advanced membrane bioreactor (MBR) system to treat process wastewater and enable water reuse. The engineering team must determine if the investment meets corporate hurdle rate requirements using BCR analysis.
Given Parameters:
- Initial capital investment: $2,750,000 (equipment, installation, commissioning)
- Annual operating costs: $385,000 (energy, membrane replacement, labor, chemicals)
- Current municipal water costs: $4.85 per thousand gallons
- Current wastewater discharge fees: $6.20 per thousand gallons
- Water reuse potential: 95 million gallons/year
- Regulatory compliance penalty avoidance: $125,000/year (projected discharge limit violations)
- Corporate discount rate: 9.5%
- System design life: 18 years
- Salvage value: $220,000 (membrane modules, controls)
Solution Process:
Step 1: Calculate Annual Benefits
Water cost savings = 95,000,000 gallons × ($4.85/1000) = $460,750/year
Discharge fee savings = 95,000,000 gallons × ($6.20/1000) = $589,000/year
Compliance penalty avoidance = $125,000/year
Total annual benefits = $460,750 + $589,000 + $125,000 = $1,174,750/year
Step 2: Calculate Present Value of Benefits
Using summation formula for geometric series over 18 years at r = 0.095:
PV(Benefits) = $1,174,750 × [(1 - (1.095)-18) / 0.095]
PV(Benefits) = $1,174,750 × [1 - 0.1945] / 0.095
PV(Benefits) = $1,174,750 × 8.4814
PV(Benefits) = $9,964,535
Add salvage value discounted to year 18:
PV(Salvage) = $220,000 / (1.095)18 = $220,000 / 5.142 = $42,788
Total PV(Benefits) = $9,964,535 + $42,788 = $10,007,323
Step 3: Calculate Present Value of Costs
Initial investment (year 0) = $2,750,000
PV(Operating Costs) = $385,000 × 8.4814 = $3,265,339
Total PV(Costs) = $2,750,000 + $3,265,339 = $6,015,339
Step 4: Calculate BCR
BCR = $10,007,323 / $6,015,339 = 1.664
Step 5: Interpret Results
Net Present Value = $10,007,323 - $6,015,339 = $3,991,984
Since BCR = 1.664 > 1.0, the project is economically justified. For every dollar invested, the facility realizes $1.66 in present-value benefits. The positive NPV of $3.99 million confirms substantial value creation beyond the 9.5% hurdle rate.
Sensitivity Analysis: If the discount rate increases to 12%, the annuity factor becomes 7.2497, reducing PV(Benefits) to $8,560,042, PV(Costs) to $5,541,139, and BCR to 1.545—still acceptable but with reduced margin. This demonstrates BCR sensitivity to discount rate assumptions, emphasizing the importance of using appropriate corporate cost of capital.
Risk and Uncertainty Considerations
Deterministic BCR calculations assume perfect knowledge of future cash flows, yet engineering projects face technical risk, market volatility, regulatory changes, and demand uncertainty. Monte Carlo simulation addresses this limitation by modeling input parameters as probability distributions rather than point estimates, generating BCR probability distributions that quantify the likelihood of achieving BCR thresholds. A project with mean BCR of 1.35 but 28% probability of BCR falling below 1.0 presents substantially different risk profile than a project with mean BCR of 1.15 but only 5% probability of inadequate returns.
Real options analysis extends BCR methodology to account for managerial flexibility—the value of waiting for additional information, staged implementation, or abandonment options. Infrastructure projects with modular expansion capability possess embedded call options that traditional BCR calculations undervalue, particularly in environments with uncertain demand growth or evolving technology landscapes.
For more engineering economics tools and financial calculators, visit our comprehensive calculator library.
Practical Applications
Scenario: Municipal Bridge Replacement Decision
Marcus, a city transportation engineer, must justify a $12.3 million bridge replacement project to the city council. The existing 68-year-old structure requires $420,000 in emergency repairs every 18 months and limits truck traffic to 22 tons, forcing commercial vehicles on 14-mile detours. Marcus uses this BCR calculator to quantify benefits: annual savings of $280,000 in maintenance, $735,000 in reduced commercial transport costs (fuel and time), $180,000 in accident reduction (the old bridge has 4.2x the accident rate), and $95,000 in emergency vehicle response time improvements. Over the bridge's 75-year design life with a 4.5% municipal discount rate, he calculates a BCR of 2.38, demonstrating that every tax dollar invested returns $2.38 in community value. This compelling ratio, combined with the $16.7 million NPV, secures unanimous council approval and positions the project for state infrastructure grant funding.
Scenario: Manufacturing Automation Investment
Jennifer, operations director at a precision machining company, evaluates replacing manual assembly stations with collaborative robots (cobots). The $847,000 investment (including integration and training) would reduce labor costs by $365,000 annually while improving quality—reducing scrap from 3.8% to 0.7%, worth $127,000 yearly. Worker injury incidents would decrease, saving $48,000 in workers' compensation costs. She runs the present value BCR calculator with her company's 11% cost of capital over the cobots' 12-year operational life, factoring in $72,000 annual maintenance. The calculation yields BCR of 1.67, clearly exceeding the corporate threshold of 1.25 for capital projects. However, when she compares this against an alternative $1.2 million fully-automated cell using the incremental BCR mode, she discovers the additional $353,000 investment only generates $91,000 in extra annual benefits, producing an incremental BCR of 0.84. This analysis guides her to recommend the cobot solution, avoiding the financially inefficient over-automation trap that her intuition initially favored.
Scenario: Energy Efficiency Retrofit Analysis
Carlos, facilities manager for a university campus, proposes installing LED lighting, upgraded HVAC controls, and building envelope improvements across 23 buildings. The comprehensive energy audit projects $2.87 million in costs but estimates $563,000 in annual utility savings, $78,000 in reduced maintenance, and $145,000 in avoided carbon offset purchases under the university's climate neutrality commitment. Using this calculator's present value mode with the university's 6.5% social discount rate and 22-year project horizon, Carlos calculates a BCR of 1.94. This strong ratio helps secure funding from the campus sustainability fund, but more importantly, when he presents to the board of trustees, the $4.1 million NPV and clear BCR metric resonates with both the financially-oriented and environmentally-focused board members. The university approves the project, and Carlos uses the saved energy costs to establish a revolving fund that finances additional sustainability projects—demonstrating how one well-analyzed BCR calculation can catalyze an entire program of continuous improvement.
Frequently Asked Questions
Free Engineering Calculators
Explore our complete library of free engineering and physics calculators.
Browse All Calculators →🔗 Explore More Free Engineering Calculators
About the Author
Robbie Dickson — Chief Engineer & Founder, FIRGELLI Automations
Robbie Dickson brings over two decades of engineering expertise to FIRGELLI Automations. With a distinguished career at Rolls-Royce, BMW, and Ford, he has deep expertise in mechanical systems, actuator technology, and precision engineering.
Need to implement these calculations?
Explore the precision-engineered motion control solutions used by top engineers.


