When you build a mechanical assembly, the dimensional tolerances of each part add up. If you don't plan for this, you may end up with an assembly that doesn't go together, binds, or just drifts out of spec. This Tolerance Stack-Up Calculator lets you quickly run the numbers on worst-case and RSS gap variations, using each part's nominal dimension and bilateral tolerance. This matters if you're working on precision manufacturing, mounting actuators, aerospace parts, or anywhere small errors can stack up quickly. Below you’ll find the formulas, a sample calculation, some context, and answers to common questions.
What is tolerance stack-up?
Tolerance stack-up is what happens when individual part size variances accumulate in an assembly. When you bolt or stack parts together, you don’t just get the variation of a single part — the total deviation in the finished assembly is the sum effect of all the parts’ tolerances put together.
Simple Explanation
If you lined up a few wooden blocks, each one cut a little short or a bit long, the pile wouldn’t measure out to exactly the sum of the nominal lengths. With five blocks, you might see an obvious misalignment or a gap where you didn’t want one. Tolerance stack-up analysis helps you understand how far off you could get, so you can adjust your design before hitting production.
📐 Browse all 1000+ Interactive Calculators

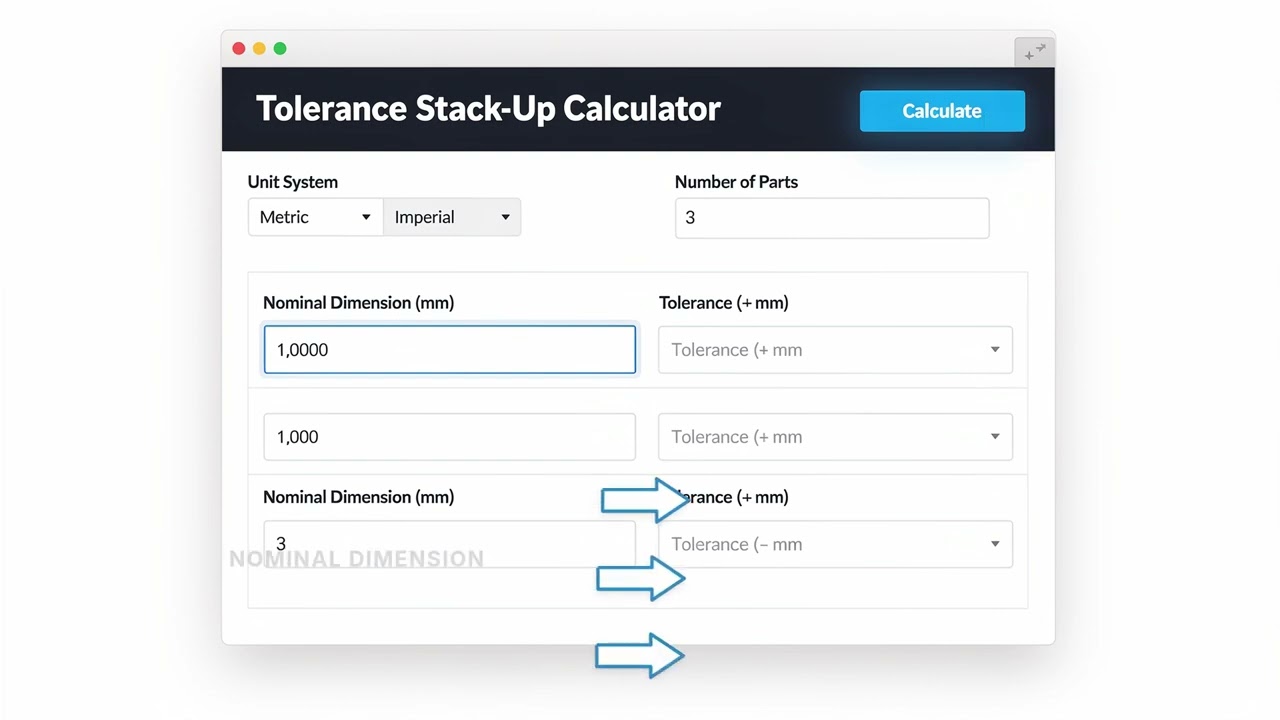
How to Use This Calculator
- Select your unit system — metric (mm) or imperial (inches).
- Enter the number of parts in your assembly (2–10).
- For each part, enter the nominal dimension and its bilateral tolerance (±).
- Click Calculate to see your result.
Tolerance Stack-Up Calculator
This calculator is intended for education, concept evaluation, and preliminary design. Results are based on the equations and assumptions described on this page, but cannot account for every real-world load case, tolerance, material property, environmental condition, installation detail, safety factor, code, or regulatory requirement. Verify all inputs, assumptions, units, and results independently before selecting components or using the result in a real application. Safety-critical, structural, medical, lifting, transportation, or regulated applications must be reviewed by a qualified engineer.
Questions about this calculator or found an error? Message our engineering team.
Tolerance Stack-Up interactive visualizer
Watch how individual part tolerances accumulate in assemblies using worst-case and RSS methods. Adjust part dimensions and tolerances to see real-time stack-up calculations for precision manufacturing applications.
WORST CASE
±0.60 mm
RSS METHOD
±0.30 mm
NOMINAL TOTAL
120.0 mm
FIRGELLI Automations — Interactive Engineering Calculators
Mathematical Equations
Worst Case Method
Use the formula below to calculate worst-case tolerance accumulation.
WC = Σ|toli|
Where WC is the worst-case tolerance accumulation and toli is the tolerance of the i-th component.
Root Sum Square (RSS) Method
Use the formula below to calculate RSS tolerance accumulation.
RSS = √(Σtoli²)
Where RSS is the root sum square tolerance accumulation and toli is the tolerance of the i-th component.
Simple Example
3 parts in a linear assembly, each with a 0.05 mm tolerance:
- Nominal dimensions: 50.00 mm, 30.00 mm, 20.00 mm → Total nominal = 100.00 mm
- Worst case: 0.05 + 0.05 + 0.05 = ±0.15 mm → Assembly range: 99.85–100.15 mm
- RSS: √(0.05² + 0.05² + 0.05²) = √0.0075 = ±0.087 mm → Assembly range: 99.913–100.087 mm
Complete Technical Guide to Tolerance Stack-Up Analysis
If you’re designing assemblies from multiple parts, you’ll need to know how those individual tolerances add up. This calculator gives you both the worst-case and RSS approaches — each has its place depending on your requirements and production volume.
Understanding Tolerance Stack-Up Fundamentals
Stack up a bunch of machined parts end-to-end and the total variation can be much more than you see in any single part. For a simple example, five plates lined up: each plate can be off by a bit, and the total could end up well outside the range you’d expect if you only looked at one piece at a time.
There are two common ways engineers run these numbers: worst-case and root sum square (RSS). Which you use depends on how critical your fit/function is, and how much risk and rework you can tolerate.
Worst-Case Analysis
The worst-case method is simple — you assume every part is at the far end of its tolerance in the same direction. Add up all the tolerances for the total stack. This isn’t subtle, but if you want to guarantee every assembly is in spec no matter which parts you grab, this is how you do it.
The worst-case method is typically used when:
- You can’t risk an out-of-spec result (safety is involved)
- You are building a handful of prototypes or low-volume runs
- Swapping any part with any other needs to just work
- The cost of a mistake outweighs the cost of tight manufacturing
Root Sum Square (RSS) Analysis
RSS assumes the variations average out — not every part will be at the worst possible value at the same time. You square each part’s tolerance, sum them, and take the square root. This gives you the expected statistical range if variations are random (normal distribution).
RSS is a good fit if:
- You’re running large production batches
- Cost and manufacturability matter more than the absolute worst outlier
- The assembly has many parts (statistical effects combine)
- You monitor process capability in production
Practical Example: Linear Actuator Assembly
Say you’re mounting a linear actuator using five parts:
- Base plate: 100.00 ± 0.10 mm
- Spacer 1: 25.00 ± 0.05 mm
- Bracket body: 150.00 ± 0.15 mm
- Spacer 2: 30.00 ± 0.08 mm
- End cap: 45.00 ± 0.06 mm
Worst-case stacking gives you:
Nominal = 350.00 mm
Worst-case tolerance = 0.10 + 0.05 + 0.15 + 0.08 + 0.06 = 0.44 mm
So your max/min is 349.56 to 350.44 mm.
RSS stacking:
√(0.10² + 0.05² + 0.15² + 0.08² + 0.06²) = √0.0374 = 0.193 mm
Range is 349.807 to 350.193 mm
RSS lets you open up tolerances (and lower costs) if it matches your risk and production strategy.
Design Considerations and Best Practices
When you’re running a stack-up analysis, the results only mean something if you consider a few practical realities:
Manufacturing Process Selection
Some processes hold tighter tolerances than others. Machining is more precise than casting or molding. For an assembly with linear actuators or anything where fit-up matters, set your tolereances to match what each process reliably gives you.
Tolerance Allocation Strategy
Not every surface or component in your design needs the same tolerance. Identify what actually matters for function, tighten those, and open up tolerance on non-critical parts. This saves time and money at the machine shop.
Assembly Method Impact
How you assemble matters. Permanent joints won’t allow for any adjustment. Assemblies with some “give” — for example, slotted holes or shims — let you deal with more variation. For actuator setups, built-in adjustment can solve a lot of headache from part variation.
Environmental Factors
Dimensional changes from temperature or humidity aren’t just theory — they’re real in some assemblies. For precision jobs, factor in expansion/contraction for each material and the kind of environment the assembly will see in service.
Advanced Tolerance Analysis Techniques
Monte Carlo Simulation
If you’re working on a complex assembly, a Monte Carlo simulation can help predict real assembly variation by simulating the random nature of component variability. It’s more resource-intensive but can reveal issues basic stack-up math might miss.
Six Sigma Methodology
Six Sigma tools look at both design tolerances and the actual capability of your process. The aim is to keep defects down and processes under control, not just chase tighter tolerances for their own sake.
Applications in Linear Actuator Systems
Stack-up analysis gets critical when you’re mounting actuators with tight travel or alignment requirements. Watch out for:
- Bracket alignment
- Clearance along the actuator’s stroke
- Bearing and guide tolerances
- Stack-up at all interface points
Use RSS if you’re managing costs or running high volumes and can live with a small statistical risk. Go worst-case if your application absolutely cannot go out of bounds.
Quality Control and Verification
After you’ve done your calculations, check the real parts. In production, track assembly variation — if you’re drifting, it means you either need to revisit your tolerances, processes, or both.
Every time your design or supplier changes, re-do the stack up. Process drift, revised parts, or updated methods can throw off even a conservative tolerance scheme.
Frequently Asked Questions
📐 Browse all 1000+ Interactive Calculators →
About the Author
Robbie Dickson
Chief Engineer & Founder, FIRGELLI Automations
Robbie Dickson brings over two decades of engineering expertise to FIRGELLI Automations. With a distinguished career at Rolls-Royce, BMW, and Ford, he has deep expertise in mechanical systems, actuator technology, and precision engineering.
🔗 Related Engineering Calculators
More related engineering calculators:
- Thread Pitch Calculator Metric and Imperial
- Press Fit Calculator Interference and Force
- Runout Calculator Circular and Total Runout
- Floating Fastener Calculator GD T Position
- Fixed Fastener Calculator GD T Position
- True Position Calculator From X Y Data
- Shaft Hole Fit Calculator ISO 286
- Flat Plate Stress and Deflection Calculator
- Torsional Stress Calculator Solid and Hollow Shafts
- Strain Calculator Engineering and True
Browse all engineering calculators →
📹 Video Walkthrough — How to Use This Calculator
📹 Video Walkthrough — How to Use This Calculator
Need to implement these calculations?
Explore the precision-engineered motion control solutions used by top engineers.


