Deciding whether to manufacture a component in-house or purchase it from a supplier is one of the most consequential cost decisions in any production operation — get it wrong and you're either overpaying a supplier or tying up capital in equipment that doesn't earn its keep. Use this Make vs Buy Outsourcing Calculator to calculate total ownership costs for both options using inputs including materials, labor, overhead, tooling, quality rates, and supplier pricing. It matters across manufacturing, procurement, and supply chain management — anywhere a wrong sourcing call directly hits the bottom line. This page includes the full cost equations, a worked example, theory on breakeven and NPV analysis, and a detailed FAQ.
What is Make vs Buy Analysis?
Make vs buy analysis is the process of comparing the true total cost of producing a component yourself against the cost of purchasing it from an external supplier. It gives you a number-backed answer to one of manufacturing's most common strategic questions.
Simple Explanation
Think of it like deciding whether to cook dinner at home or order takeout — both options cost money, but in different ways. Making something in-house costs you equipment, labor, and materials. Buying it costs you the supplier's price plus shipping, management time, and quality inspection. This calculator adds up every cost on both sides so you can see which option actually costs less.
📐 Browse all 1000+ Interactive Calculators
Visual Diagram

Make vs Buy Outsourcing Calculator
How to Use This Calculator
- Select a Calculation Mode from the dropdown — Total Cost Comparison, Breakeven Volume, Unit Cost, Savings Analysis, or ROI & Payback.
- Enter your Make (in-house) costs: annual volume, material cost per unit, labor cost per unit, variable overhead, fixed overhead, tooling cost and life, and quality/rework rate.
- Enter your Buy (outsource) costs: purchase price per unit, shipping cost, annual management cost, and incoming quality rate.
- Click Calculate to see your result.
Make (In-House) Costs
Buy (Outsource) Costs
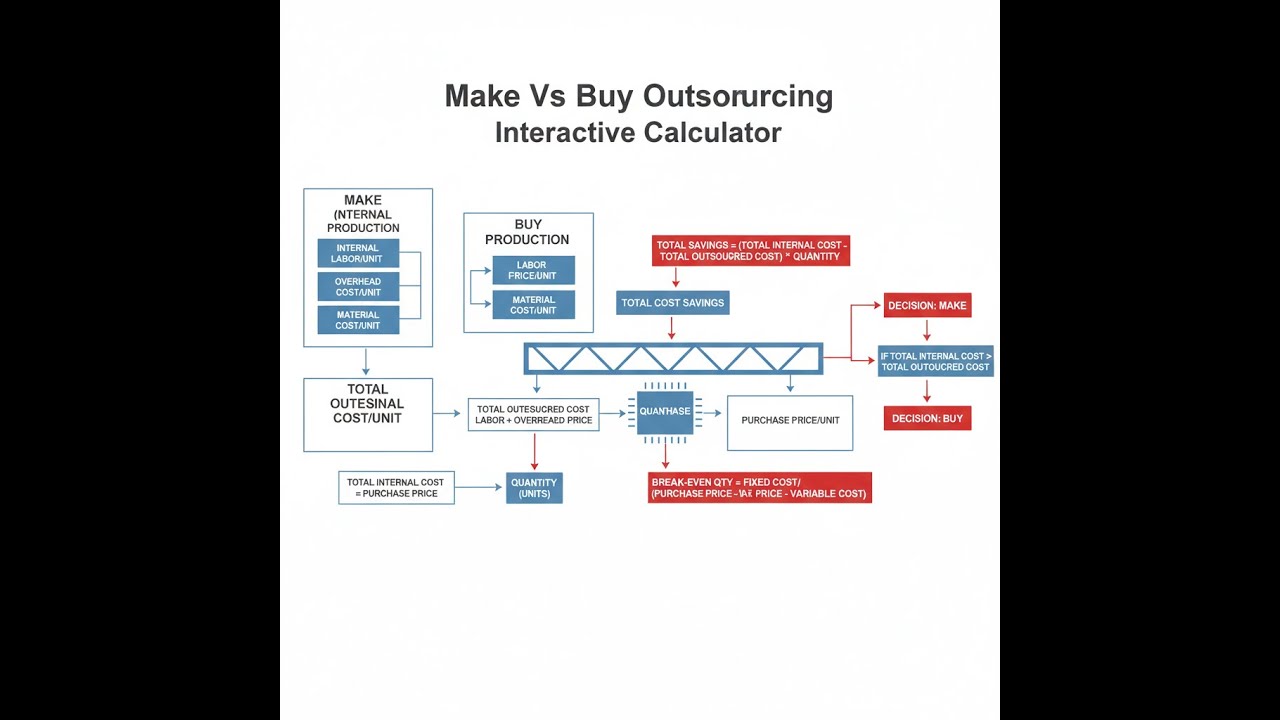
Make vs Buy Outsourcing Interactive Calculator
Visualize the complete cost breakdown between in-house manufacturing and supplier outsourcing to make optimal sourcing decisions. Adjust production volumes, costs, and quality factors to see real-time cost comparisons and breakeven analysis.
MAKE TOTAL
$310,000
BUY TOTAL
$320,000
SAVINGS
$10,000
BREAKEVEN
8,571
FIRGELLI Automations — Interactive Engineering Calculators
Cost Equations
Use the formula below to calculate the total annual cost of making a component in-house.
Total Cost of Making (In-House)
TCmake = (Vm × Q) + Fm + (T / L) + Cq,make
Where:
- TCmake = Total annual cost to make in-house ($)
- Vm = Variable cost per unit (material + labor + variable overhead) ($/unit)
- Q = Annual production volume (units/year)
- Fm = Annual fixed overhead costs ($)
- T = Tooling and equipment investment cost ($)
- L = Expected tooling life (years)
- Cq,make = Quality and rework costs ($)
Use the formula below to calculate the total annual cost of buying from an external supplier.
Total Cost of Buying (Outsourcing)
TCbuy = (P + S) × Q + M + Cq,buy
Where:
- TCbuy = Total annual cost to buy from supplier ($)
- P = Purchase price per unit from supplier ($/unit)
- S = Shipping and logistics cost per unit ($/unit)
- Q = Annual purchase volume (units/year)
- M = Annual supplier management costs ($)
- Cq,buy = Incoming quality inspection and defect costs ($)
Use the formula below to calculate the production volume at which make and buy costs are equal.
Breakeven Volume Analysis
Qbreakeven = (Fmake - Fbuy) / (Vbuy - Vmake)
Where:
- Qbreakeven = Production volume where costs are equal (units)
- Fmake = Fixed costs of making in-house ($/year)
- Fbuy = Fixed costs of buying from supplier ($/year)
- Vbuy = Variable cost per unit when buying ($/unit)
- Vmake = Variable cost per unit when making ($/unit)
Use the formula below to calculate the net present value of a make or buy investment decision.
Net Present Value (NPV)
NPV = Σt=1n [CFt / (1 + r)t] - I0
Where:
- NPV = Net present value of the decision ($)
- CFt = Annual cash flow (savings) in year t ($)
- r = Discount rate (decimal)
- t = Year number
- n = Project life (years)
- I0 = Initial investment or transition cost ($)
Simple Example
A manufacturer produces 5,000 units per year. In-house variable cost is $20 per unit, annual fixed costs are $40,000, and tooling amortizes at $10,000 per year — total make cost: (5,000 × $20) + $40,000 + $10,000 = $150,000 ($30 per unit). The supplier quotes $28 per unit with $1.50 shipping and $6,000 annual management cost — total buy cost: (5,000 × $29.50) + $6,000 = $153,500 ($30.70 per unit). Result: making in-house saves $3,500 per year at this volume.
Theory & Engineering Applications
Make-versus-buy analysis represents one of the most consequential strategic decisions in manufacturing and engineering operations. This decision framework extends far beyond simple cost comparison; it fundamentally shapes organizational capabilities, supply chain resilience, competitive positioning, and long-term profitability. Engineering managers, procurement specialists, and financial analysts use rigorous quantitative methods to evaluate whether vertical integration (making) or strategic outsourcing (buying) delivers superior value across multiple dimensions including cost, quality, capacity, intellectual property protection, and market responsiveness.
Comprehensive Cost Structure Analysis
The foundation of make-versus-buy decisions lies in accurate total cost of ownership (TCO) modeling. Many organizations make suboptimal decisions by focusing exclusively on unit price while overlooking substantial hidden costs. For in-house manufacturing, variable costs include direct materials, direct labor at fully-loaded rates (including benefits, taxes, and overtime premiums), and variable manufacturing overhead such as utilities, consumables, and maintenance. Fixed costs encompass facility depreciation, equipment amortization, supervisory salaries, quality assurance functions, and allocated corporate overhead. A critical but frequently underestimated component is tooling and equipment investment, which must be amortized over the expected production volume and equipment life—not simply divided equally across years, since production volumes often vary substantially.
For purchased components, the landed cost includes not only the supplier's quoted price but also inbound freight, customs duties and tariffs for imported goods, receiving inspection costs, inventory carrying costs (typically 18-25% annually of average inventory value), payment terms impacts, and supplier management overhead including purchasing staff time, supplier audits, and quality engineering support. An often-overlooked factor is the cost of quality failures: in-house production may have 2-4% defect rates with immediate rework capability, while purchased components might have 0.5-2% defect rates but require expensive return logistics, production delays, and potential customer impact if defects reach the field. The quality cost differential can shift decisions by $50,000-$200,000 annually for medium-volume production (10,000-50,000 units/year).
Strategic Considerations Beyond Direct Costs
Advanced make-versus-buy frameworks incorporate strategic factors that cannot be reduced to immediate financial metrics. Core competency protection is paramount: components embodying proprietary technology, unique processes, or competitive differentiation should generally be produced in-house to prevent intellectual property leakage and maintain technological leadership. Conversely, commodity components with mature technologies and multiple qualified suppliers are ideal outsourcing candidates, freeing internal capacity for higher-value activities. Capacity utilization analysis reveals whether existing manufacturing resources operate below optimal levels—if internal capacity utilization falls below 65-75%, marginal production costs decrease substantially, making in-house production attractive even when fully-absorbed costs appear higher than purchase prices.
Supply chain risk management introduces qualitative dimensions that modify purely financial conclusions. Single-source suppliers create vulnerability to disruptions, price increases, and quality variations, potentially justifying higher internal production costs for business continuity assurance. Geographic considerations matter: domestic production provides shorter lead times, reduced inventory requirements, enhanced responsiveness to design changes, and elimination of currency exchange risks, but typically costs 15-35% more than offshore alternatives. During the 2020-2022 supply chain disruptions, many companies discovered that 20-30% cost savings from offshore sourcing evaporated when facing six-month lead times, minimum order quantities forcing excess inventory, and emergency air freight expenses exceeding normal ocean freight costs by 8-12×.
Breakeven Volume and Sensitivity Analysis
Breakeven volume calculations identify the production threshold where make and buy alternatives yield equivalent total costs. This analysis proves most valuable when demand uncertainty exists or when evaluating whether to invest in manufacturing capability for new products with unproven market acceptance. The breakeven formula QBE = (Fmake - Fbuy) / (Vbuy - Vmake) reveals that breakeven volume increases as fixed cost differential rises or as variable cost differential narrows. For example, if making requires $120,000 additional annual fixed costs but saves $4.50 per unit in variable costs, breakeven occurs at approximately 26,667 units. Production volumes below this threshold favor buying; volumes above favor making.
Sensitivity analysis examines how decision outcomes change as key assumptions vary. Critical variables include production volume fluctuations (±20-30% variations are common in many industries), material cost volatility (steel, copper, and plastics can swing 30-50% over 18-24 month cycles), labor rate changes (annual increases of 2-5% are typical), and supplier price adjustments (which may occur annually or at contract renewal). Sophisticated analyses use Monte Carlo simulation with probability distributions for each variable, generating probability-weighted expected values rather than single-point estimates. This approach might reveal that while the expected value favors buying by $45,000 annually, there exists a 35% probability that making would actually cost less under realistic scenario variations—information that substantially influences risk-tolerant versus risk-averse decision-makers.
Real-World Worked Example: Automotive Bracket Component
Consider a precision-machined aluminum mounting bracket for an electric vehicle battery system, with projected annual demand of 12,500 units. Engineering analysis establishes the following cost structure for in-house manufacturing: aluminum billet material costs $8.35 per unit after scrap allowance, CNC machining requires 14.3 minutes of operator time plus machine time at a fully-loaded rate of $47.50 per hour yielding $11.31 per unit, variable overhead (cutting fluids, tool wear, quality inspection) adds $4.28 per unit, giving total variable cost of $23.94 per unit. Fixed costs include annual CNC machine depreciation of $28,000, allocated facility overhead of $19,500, quality engineering support of $12,800, and production supervision of $15,200, totaling $75,500 annually. Initial tooling investment of $87,000 for fixtures, cutting tools, and programming has an expected five-year life.
The outsourcing alternative quotes a purchase price of $29.50 per unit FOB supplier facility. Inbound freight averages $1.35 per unit for consolidated truckload shipments. Receiving inspection requires 0.8 hours per 50-unit lot at $42/hour, adding $0.67 per unit. Annual supplier management (buyer time, audits, communication) costs $9,800. Quality history shows the supplier maintains 0.8% defect rate versus 2.3% for internal production; at $29.50 per unit, supplier defects cost approximately $2,950 annually for replacement parts and handling, while internal rework of 2.3% defective parts at $23.94 variable cost equals $7,285 annually.
Calculating total costs: In-house manufacturing totals $23.94 × 12,500 = $299,250 variable costs + $75,500 fixed costs + $87,000/5 = $17,400 tooling amortization + $7,285 quality costs = $399,435 annually, or $31.95 per unit. Outsourcing totals ($29.50 + $1.35 + $0.67) × 12,500 = $394,000 + $9,800 management + $2,950 quality = $406,750 annually, or $32.54 per unit. The analysis reveals in-house production saves $7,315 annually (1.8%) at 12,500 units—a marginal advantage suggesting other factors like capacity availability, strategic importance, and risk tolerance should govern the final decision.
Performing breakeven analysis: Fixed cost differential is $75,500 + $17,400 - $9,800 = $83,100 favoring buy. Variable cost differential is $31.52 - $23.94 = $7.58 per unit favoring make. Breakeven volume equals $83,100 / $7.58 = 10,961 units. Below 10,961 units annually, outsourcing costs less; above this threshold, in-house production becomes increasingly advantageous. If demand growth projections show likely volume increasing to 18,000 units within two years, the case for internal manufacturing strengthens considerably, as annual savings would grow to approximately ($31.52 - $23.94) × 18,000 - $83,100 = $53,340, representing 13.1% cost reduction and justifying the tooling investment even without considering strategic benefits of production capability and supply chain control.
Additional analysis examines sensitivity to aluminum price volatility. If aluminum prices increase 20% (not uncommon during commodity cycles), material costs rise to $10.02 per unit, increasing total variable cost to $25.61 per unit and total make cost to $412,010 ($32.96/unit), while the outsourcing quote might increase only 6-8% to $31.27 per unit based on the supplier's larger purchasing power and hedging strategies, reversing the cost advantage. This sensitivity highlights material cost risk as a key consideration: organizations with high material cost exposure but limited hedging capability may prefer outsourcing to suppliers with better commodity risk management.
Dynamic Decision-Making and Option Value
Make-versus-buy decisions should not be viewed as permanent commitments. Leading organizations treat these as dynamic choices, periodically reassessing as market conditions, technologies, volumes, and strategic priorities evolve. The "option value" of maintaining dual-source capability—producing some volume internally while purchasing from external suppliers—provides flexibility to respond to capacity constraints, quality issues, cost variations, and supply disruptions. This hybrid approach typically costs 3-8% more than pure make or pure buy strategies but delivers risk mitigation and negotiating leverage worth substantially more than the cost premium in volatile industries.
For emerging technologies and new product introductions, a phased approach often proves optimal: initial low-volume production uses external suppliers to minimize capital investment and validate designs, while internal manufacturing capability develops in parallel. Once design matures and volumes reach 40-60% of breakeven threshold, production transitions in-house to capture cost advantages and protect intellectual property. This sequential decision-making recognizes that uncertainty resolution over time enables better choices than forcing premature commitment under high uncertainty.
You can explore related financial analysis tools in our comprehensive engineering calculator library, including cost estimation, ROI analysis, and capacity planning resources that complement make-versus-buy decision frameworks.
Practical Applications
Scenario: Medical Device Manufacturing Decision
Jennifer, a manufacturing director at a mid-sized medical device company, faces a critical decision about producing injection-molded housings for a new diagnostic instrument. Her preliminary analysis shows that purchasing from a specialized molder costs $18.75 per unit including shipping for an anticipated volume of 8,500 units annually. Setting up internal production requires a $215,000 investment in a precision injection molding machine with an eight-year life, plus $42,000 in mold tooling with a five-year life. Variable costs for internal production total $11.30 per unit (resin, labor, utilities), with annual fixed costs of $38,500 for maintenance, quality control, and supervision. Using the calculator's total cost comparison mode, Jennifer discovers that in-house production costs $31.87 per unit versus $18.75 for outsourcing at 8,500 units—making buying the clear winner. However, the breakeven analysis reveals that if volume reaches 14,200 units (within range of optimistic market forecasts), internal production becomes $43,600 cheaper annually. Jennifer decides to outsource initially while designing manufacturing space and utility connections for future equipment, preserving the option to bring production in-house when volumes justify the investment. This staged approach minimizes upfront capital commitment while maintaining strategic flexibility for future vertical integration.
Scenario: Industrial Equipment Component Sourcing
Marcus, a senior procurement engineer at a construction equipment manufacturer, evaluates whether to continue machining hydraulic valve bodies in-house or switch to a low-cost offshore supplier offering 27% price reduction. Current internal costs run $147.30 per unit fully absorbed for 6,200 units annually, while the offshore quote is $107.50 per unit plus $8.20 shipping. Using the calculator's savings analysis mode with realistic transition costs ($68,000 for supplier qualification, first article inspection, process validation, and safety stock buildup), Marcus calculates apparent annual savings of $193,660. However, he recognizes that the analysis omits several critical factors: lead time increases from two days to 14 weeks, requiring $285,000 additional inventory investment; quality risk from a supplier with no track record on this component family; and loss of rapid prototyping capability that currently supports engineering changes within 48 hours. The ROI analysis mode shows that including inventory carrying costs (22% annually) reduces real annual savings to $130,960, extending payback from 4.2 months to 8.7 months. Marcus recommends continuing internal production, noting that the marginal cost savings don't justify sacrificing engineering responsiveness and introducing significant supply chain risk for a component that directly impacts equipment safety and represents a core manufacturing competency.
Scenario: Electronics Assembly Strategic Sourcing
Priya, a supply chain manager for an IoT device manufacturer, analyzes whether to establish internal PCB assembly capability or continue using contract manufacturers. Her company currently outsources assembly of 28,000 boards annually at $47.25 per board including components, assembly, testing, and logistics. Internal production would require $420,000 in SMT placement equipment, reflow ovens, and test fixtures with a seven-year life, plus annual fixed costs of $95,000 for dedicated technicians and facility space. Variable costs including components (purchased at similar pricing), solder paste, and utilities total $34.80 per board. Using the calculator's breakeven mode, Priya determines that breakeven occurs at 25,385 boards—below current volume, suggesting internal production saves money immediately. However, the unit cost analysis reveals that this conclusion depends critically on sustained high volume: at 28,000 units, internal production costs $44.59 per board versus $47.25 outsourced, saving $74,480 annually. But if volume drops to 20,000 units (within the range of conservative forecasts), internal costs rise to $49.55 per board, losing $45,000 annually versus outsourcing. Priya recognizes that demand uncertainty creates asymmetric risk: upside volume scenarios save modestly while downside scenarios lose substantially. She negotiates a hybrid solution: bringing high-runner boards representing 60% of volume in-house to capture most savings while maintaining contract manufacturer relationship for remaining volume, providing capacity buffer and risk mitigation for $32,000 annually—cheap insurance against demand volatility and equipment downtime.
Frequently Asked Questions
What hidden costs do most companies overlook in make-versus-buy analysis? +
How should volume uncertainty affect make-versus-buy decisions? +
When should strategic factors override pure cost analysis in make-versus-buy decisions? +
How do I properly account for tooling and equipment costs in make-versus-buy analysis? +
What is the optimal approach when breakeven analysis shows I'm operating right at the breakeven volume? +
How should quality differences between internal and external production influence the decision? +
Free Engineering Calculators
Explore our complete library of free engineering and physics calculators.
Browse All Calculators →🔗 Explore More Free Engineering Calculators
About the Author
Robbie Dickson — Chief Engineer & Founder, FIRGELLI Automations
Robbie Dickson brings over two decades of engineering expertise to FIRGELLI Automations. With a distinguished career at Rolls-Royce, BMW, and Ford, he has deep expertise in mechanical systems, actuator technology, and precision engineering.
Need to implement these calculations?
Explore the precision-engineered motion control solutions used by top engineers.


