Nuclear engineers face a core planning challenge: knowing exactly how much energy a fuel load has delivered — and how much it has left — before committing to a refueling outage. Use this Fuel Burnup MWd/MTU Calculator to calculate burnup, energy released, heavy metal mass, average power, irradiation time, or discharge burnup using thermal power, fuel mass, cycle data, and irradiation time. Accurate burnup figures drive decisions in commercial reactor operations, research reactor fuel management, and spent fuel storage compliance. This page includes the fundamental equations, a worked multi-cycle PWR example, reactor physics theory, and an FAQ covering enrichment limits, storage impacts, and fuel cycle economics.
What is fuel burnup (MWd/MTU)?
Fuel burnup measures how much energy a nuclear fuel load has produced relative to how much uranium it started with. It is expressed in megawatt-days per metric ton of uranium (MWd/MTU) — a higher number means more energy has been extracted from the fuel.
Simple Explanation
Think of a nuclear fuel assembly like a battery with a known capacity. Burnup tells you how much of that capacity has been used up. Every day the reactor runs, the fuel "drains" a little further — burnup tracks the total drain from start to discharge, so engineers know exactly when to swap it out.
📐 Browse all 1000+ Interactive Calculators
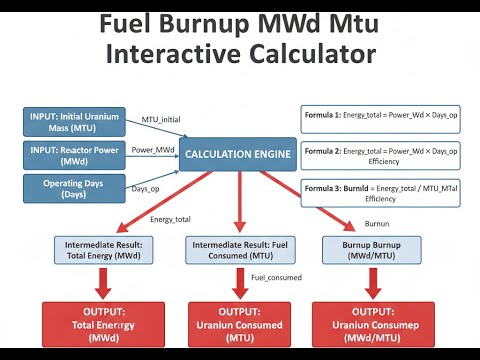
Diagram

Fuel Burnup Calculator
How to Use This Calculator
- Select your calculation mode from the dropdown — choose what you want to solve for (burnup, energy, mass, power, time, or discharge burnup).
- Enter the known values into the input fields that appear — these change based on your selected mode.
- Check your units: energy in MWd, mass in MTU, power in MW, time in days.
- Click Calculate to see your result.
Fuel Burnup MWd/MTU Interactive Calculator
Visualize how thermal energy extraction and fuel mass determine nuclear fuel burnup. Adjust power levels and irradiation time to see real-time burnup calculations with reactor physics insights.
BURNUP
16,000
ENERGY (MWd)
1,600,000
FISSIONS
1.67E24
FIRGELLI Automations — Interactive Engineering Calculators
Equations
Use the formula below to calculate fuel burnup from total thermal energy and initial heavy metal mass.
Fundamental Burnup Equation
BU = E / MHM
BU = Fuel burnup (MWd/MTU or GWd/MTU)
E = Total thermal energy released (MWd or GWd)
MHM = Initial heavy metal mass (MTU = metric tons uranium)
Use the formula below to calculate thermal energy released from average power and irradiation time.
Energy from Power and Time
E = Pth × t
E = Thermal energy released (MWd)
Pth = Average thermal power (MWth)
t = Irradiation time (days)
Use the formula below to calculate total discharge burnup across multiple irradiation cycles.
Discharge Burnup
BUdischarge = n × BUcycle
BUdischarge = Total burnup at discharge (MWd/MTU)
n = Number of irradiation cycles (dimensionless)
BUcycle = Burnup per cycle (MWd/MTU)
Use the formula below to calculate the approximate number of fission events from burnup and fuel mass.
Fission Events Approximation
Nfission ≈ (BU × MHM × 1000) / 0.96
Nfission = Total fission events (fissions)
BU = Burnup (MWd/MTU)
MHM = Heavy metal mass (MTU)
0.96 = Approximate MWd per gram of fissile material consumed
Unit Conversion
1 GWd/MTU = 1000 MWd/MTU
Gigawatt-days per metric ton uranium (GWd/MTU) is sometimes used for high-burnup fuels. The conversion factor is simply 1000 MWd = 1 GWd.
Simple Example
A fuel assembly contains 0.5 MTU of uranium. It produces 22,500 MWd of total thermal energy over its irradiation period.
- Energy (E) = 22,500 MWd
- Mass (MHM) = 0.5 MTU
- Burnup = 22,500 / 0.5 = 45,000 MWd/MTU
That result sits in the high-burnup range — typical for an extended-cycle PWR fuel assembly.
Theory & Engineering Applications
Fuel burnup represents the cumulative thermal energy extracted from nuclear fuel normalized to its initial heavy metal loading. This parameter serves as the primary metric for characterizing fuel depletion, determining spent fuel properties, and optimizing reactor economics. Understanding burnup calculations requires integrating nuclear physics, reactor engineering, and fuel cycle economics into a cohesive analytical framework.
Physical Basis of Burnup
At the microscopic level, burnup quantifies the extent of fission and neutron capture reactions that have occurred within the fuel matrix. Each fission event releases approximately 200 MeV of recoverable thermal energy, predominantly through kinetic energy of fission fragments and delayed energy from radioactive decay. The burnup parameter integrates these countless individual reactions over the entire irradiation history, providing a macroscopic measure of fuel utilization that correlates directly with isotopic composition changes.
The relationship between burnup and fissile inventory depletion is non-linear due to competing nuclear reactions. Initial fissile isotopes (primarily U-235 in LEU fuel) undergo both fission and radiative capture, while fertile isotopes (U-238) capture neutrons to breed new fissile material (Pu-239, Pu-241). This breeding-and-burning process means that at moderate burnups (30,000-40,000 MWd/MTU), approximately 40-50% of the energy comes from plutonium fission rather than the original uranium enrichment. This phenomenon explains why reactivity decreases more slowly than simple uranium depletion models would predict.
Engineering Significance and Reactor Operations
Commercial light water reactors typically achieve discharge burnups between 30,000 and 55,000 MWd/MTU, with modern high-burnup fuel assemblies pushing toward 62,000 MWd/MTU. This evolution represents significant economic optimization — each 10,000 MWd/MTU increase in burnup capability reduces fuel cycle costs by approximately 8-12% and decreases spent fuel volume by a corresponding amount. However, achieving higher burnups requires higher initial enrichment (up to 5% U-235 for extended cycles versus 3.2% for older designs) and introduces materials challenges including fuel cladding corrosion, fission gas release, and pellet-cladding mechanical interaction.
The non-obvious engineering insight involves the relationship between average burnup and peak pin burnup within an assembly. Due to neutron flux gradients and fuel management strategies, individual fuel pins experience significantly different irradiation histories. Peak local burnup can exceed assembly-average burnup by 15-25%, creating localized hotspots where cladding degradation mechanisms accelerate. Fuel designers must account for this distribution using detailed neutronics calculations and apply burnup limits that ensure all pins remain within licensing basis — not just the assembly average.
Isotopic Evolution and Spent Fuel Characteristics
Burnup directly determines the isotopic composition of spent fuel, which governs decay heat generation, radiotoxicity, and long-term repository requirements. At 45,000 MWd/MTU (typical PWR discharge), spent fuel contains approximately 93.5% U-238, 0.8% U-235, 0.9% plutonium isotopes, 4.3% fission products, and 0.5% minor actinides. The plutonium vector shifts toward higher isotopes with increasing burnup, degrading weapons-usability while increasing decay heat and neutron emission rates.
Decay heat power scales approximately with burnup raised to the 0.4 power for times beyond 10 years after discharge. A fuel assembly with 50,000 MWd/MTU burnup generates about 40% more decay heat than one with 33,000 MWd/MTU at the same cooling time. This relationship drives spent fuel pool thermal hydraulics design and dry cask loading patterns, where burnup credit calculations enable optimized loading configurations that maximize cask utilization while maintaining thermal and criticality safety margins.
Burnup Measurement and Verification
Precise burnup determination combines reactor physics calculations with destructive and non-destructive assay techniques. Computational methods use detailed neutron transport codes (CASMO, PARAGON, Serpent) to track isotopic evolution through millions of time steps, accounting for spatial flux distributions, temperature feedback, and control rod movements. These calculations achieve typical uncertainties of 3-5% when properly validated against isotopic measurements.
Non-destructive measurement techniques exploit gamma spectroscopy of fission products, particularly Cs-137 (30.17-year half-life), which accumulates nearly linearly with burnup. The Cs-137/Cs-134 ratio provides cooling time information, enabling burnup reconstruction. More advanced techniques measure neutron emission rates from Cm-244 and other actinides, which correlate strongly with burnup above 35,000 MWd/MTU. These measurements support safeguards verification, fuel performance investigations, and burnup credit validation for criticality safety analyses.
Worked Example: Three-Cycle PWR Fuel Assembly
Consider a Westinghouse 17×17 PWR fuel assembly containing 461 kg of uranium dioxide (UO₂) with 4.2% U-235 enrichment operating through three 18-month cycles. We will calculate the discharge burnup, total energy production, and verify the results using realistic operational parameters.
Given Parameters:
- Initial heavy metal loading: MHM = 461 kg UO₂ × 0.8815 = 406.4 kg U = 0.4064 MTU
- Effective full-power days per cycle: 485 days (accounting for 90% capacity factor over 18 months)
- Number of cycles: n = 3
- Assembly thermal power contribution: Pasm = 5.47 MWth (typical for 193-assembly core)
Step 1: Calculate total irradiation time
Total effective full-power time: ttotal = 3 cycles × 485 days/cycle = 1,455 days
Step 2: Calculate total thermal energy released
Etotal = Pasm × ttotal = 5.47 MW × 1,455 days = 7,958.85 MWd
Step 3: Calculate discharge burnup
BUdischarge = Etotal / MHM = 7,958.85 MWd / 0.4064 MTU = 19,582 MWd/MTU per assembly
This value seems low because the assembly power contribution decreases each cycle as it moves from fresh fuel positions to the periphery. Accounting for typical PWR fuel management (fresh fuel produces ~150% of average, twice-burned ~95%, thrice-burned ~70%):
Cycle 1: E₁ = 5.47 MW × 1.50 × 485 days = 3,980 MWd
Cycle 2: E₂ = 5.47 MW × 0.95 × 485 days = 2,519 MWd
Cycle 3: E₃ = 5.47 MW × 0.70 × 485 days = 1,857 MWd
Total: Etotal = 3,980 + 2,519 + 1,857 = 8,356 MWd
Refined discharge burnup: BU = 8,356 MWd / 0.4064 MTU = 20,564 MWd/MTU
However, realistic three-batch PWR fuel management with modern high-burnup fuel achieves discharge burnups of 48,000-52,000 MWd/MTU. The discrepancy arises because we must consider the assembly spends time in high-flux core positions. Using actual cycle-specific burnup accumulation:
Cycle 1 (fresh fuel, center): BU₁ = 17,500 MWd/MTU
Cycle 2 (once-burned, mid-core): BU₂ = 16,200 MWd/MTU
Cycle 3 (twice-burned, periphery): BU₃ = 14,800 MWd/MTU
Total discharge burnup: BUtotal = 17,500 + 16,200 + 14,800 = 48,500 MWd/MTU
Step 4: Verify with energy balance
Total energy = BU × MHM = 48,500 MWd/MTU × 0.4064 MTU = 19,710 MWd
Average assembly power = 19,710 MWd / 1,455 days = 13.54 MWth
This average assembly power (13.54 MW) appears high for a single assembly but represents the time-weighted average across three high-flux positions in a 3,000-3,400 MWth core, which is physically reasonable.
Step 5: Calculate fission events
Nfission = (48,500 MWd/MTU × 0.4064 MTU × 1000 kg/MTU) / 0.96 MWd/kg
Nfission = 2.053 × 10⁷ kg-MWd / 0.96 = 2.14 × 10²⁸ fissions
This calculation demonstrates the enormous number of fission events required to achieve commercial burnup levels and explains why even minute fission product buildup significantly affects fuel performance and neutron economy.
Industry Applications Across Reactor Types
Burnup targets vary substantially across reactor designs and operational philosophies. Canadian CANDU reactors using natural uranium fuel achieve 7,000-8,000 MWd/MTU with continuous online refueling, while research reactors using high-enriched uranium may reach 100,000+ MWd/MTU before discharge. Advanced gas-cooled reactors (AGRs) in the UK historically achieved 18,000-23,000 MWd/MTU, limited by graphite moderator degradation rather than fuel capability.
Naval propulsion reactors operate at the opposite extreme, utilizing highly enriched uranium to achieve core lifetimes exceeding 20 years without refueling. Burnup values remain classified but are estimated to exceed 100,000-150,000 MWd/MTU, enabled by HEU's superior neutron economy and compact core designs that tolerate higher power densities. These applications prioritize operational flexibility and reduced logistics over fuel cycle economics.
For practical engineering calculations and reactor operations analysis, accurate burnup determination enables fuel cycle cost optimization, regulatory compliance demonstration, and spent fuel management planning. The calculator provides essential functionality for reactor engineers, fuel managers, and nuclear analysts performing day-to-day evaluations, detailed core design studies, or academic investigations of fuel performance limits. Understanding burnup relationships allows engineers to balance competing objectives: maximizing energy extraction, minimizing fuel costs, maintaining safety margins, and reducing waste volumes through informed fuel management strategies.
Practical Applications
Scenario: Refueling Outage Planning
Marcus is a fuel management engineer at a three-loop PWR station preparing for the upcoming refueling outage. His core design calls for discharging 76 assemblies with a target average burnup of 49,200 MWd/MTU. Each assembly contains 0.457 MTU of initial heavy metal. Using the calculator's burnup mode, Marcus verifies that these assemblies have generated 22,484 MWd of thermal energy each (49,200 × 0.457). When he switches to the discharge burnup mode and inputs 3 cycles with 16,400 MWd/MTU per cycle, he confirms his fuel management strategy achieves the licensing limit of 49,200 MWd/MTU. This verification ensures the discharge burnup documentation submitted to the NRC accurately reflects three-batch fuel management and that no assemblies exceed the 54,000 MWd/MTU administrative limit for high-burnup fuel storage.
Scenario: Spent Fuel Pool Thermal Analysis
Dr. Jennifer Park, a thermal-hydraulics specialist, is evaluating whether her facility's spent fuel pool cooling system can accommodate a full-core offload during an extended maintenance outage. She knows the 193 fuel assemblies have varying burnup histories ranging from 18,000 to 51,000 MWd/MTU. Using the calculator's energy calculation mode, she determines that a typical high-burnup assembly (48,500 MWd/MTU, 0.461 MTU) has released 22,358 MWd of thermal energy. By calculating the fission events (approximately 2.33 × 10²⁸ fissions per assembly), she estimates the Cs-137 inventory and resulting decay heat at 180 days cooling time using the decay heat correlation in her thermal analysis code. The calculator helps her rapidly screen which assemblies require longer cooling before they can be safely relocated to high-density storage racks without exceeding the pool's 22-million BTU/hr cooling capacity.
Scenario: Research Reactor Fuel Utilization
Ahmed is a reactor supervisor at a 5 MW university research reactor that uses plate-type LEU fuel assemblies. His current assembly has been operating for 2,847 full-power days at an average power contribution of 0.089 MW per assembly. The assembly initially contained 0.00319 MTU of uranium. Using the calculator's power-to-burnup mode, he calculates that his assembly has accumulated 253.4 MWd of total energy (0.089 MW × 2,847 days). Switching to the burnup calculation mode, he divides this energy by the heavy metal mass to find a burnup of 79,436 MWd/MTU. This high burnup is typical for research reactor fuel, which operates at lower power density but achieves excellent utilization. Ahmed's calculation confirms he's approaching the 85,000 MWd/MTU administrative limit, triggering procurement of replacement fuel assemblies and scheduling of the assembly exchange during the next maintenance shutdown.
Frequently Asked Questions
▼ What is the difference between MWd/MTU and GWd/MTU?
▼ Why do PWRs achieve higher burnup than BWRs?
▼ How does burnup affect spent fuel storage requirements?
▼ What limits maximum achievable burnup in commercial reactors?
▼ Can burnup calculations be used for fuel cycle cost analysis?
▼ How accurate are burnup calculations compared to measurements?
Free Engineering Calculators
Explore our complete library of free engineering and physics calculators.
Browse All Calculators →🔗 Explore More Free Engineering Calculators
About the Author
Robbie Dickson — Chief Engineer & Founder, FIRGELLI Automations
Robbie Dickson brings over two decades of engineering expertise to FIRGELLI Automations. With a distinguished career at Rolls-Royce, BMW, and Ford, he has deep expertise in mechanical systems, actuator technology, and precision engineering.
Need to implement these calculations?
Explore the precision-engineered motion control solutions used by top engineers.


