Deciding to fund a project usually comes down to a single calculation: are the benefits greater than the costs, not just in total, but when you consider timing? This Benefit Cost Ratio Calculator gives you BCRs using total benefits, total costs, discount rates, and project life, with six calculation modes. It's a staple for infrastructure choices, manufacturing investments, and environmental projects. You’ll find the formula, a full example, background, and a practical FAQ below.
What is Benefit Cost Ratio?
The Benefit Cost Ratio (BCR) is a basic ratio: it tells you how much return you get per dollar spent. If BCR is over 1.0, benefits are greater than costs, and the project could make sense. Below 1.0, you’re losing money on every dollar spent.
Simple Explanation
BCR works a lot like checking the odds on a bet: spend $100, get $150 back, BCR is 1.5, so that’s a win. Only get $80 back and BCR drops to 0.8—not worth it. The catch is that money in the future is discounted, because $100 today isn’t the same as $100 ten years from now. The BCR accounts for that using a discount rate, which reflects the fact that immediate returns are more valuable than delayed ones.
📐 Browse all 1000+ Interactive Calculators
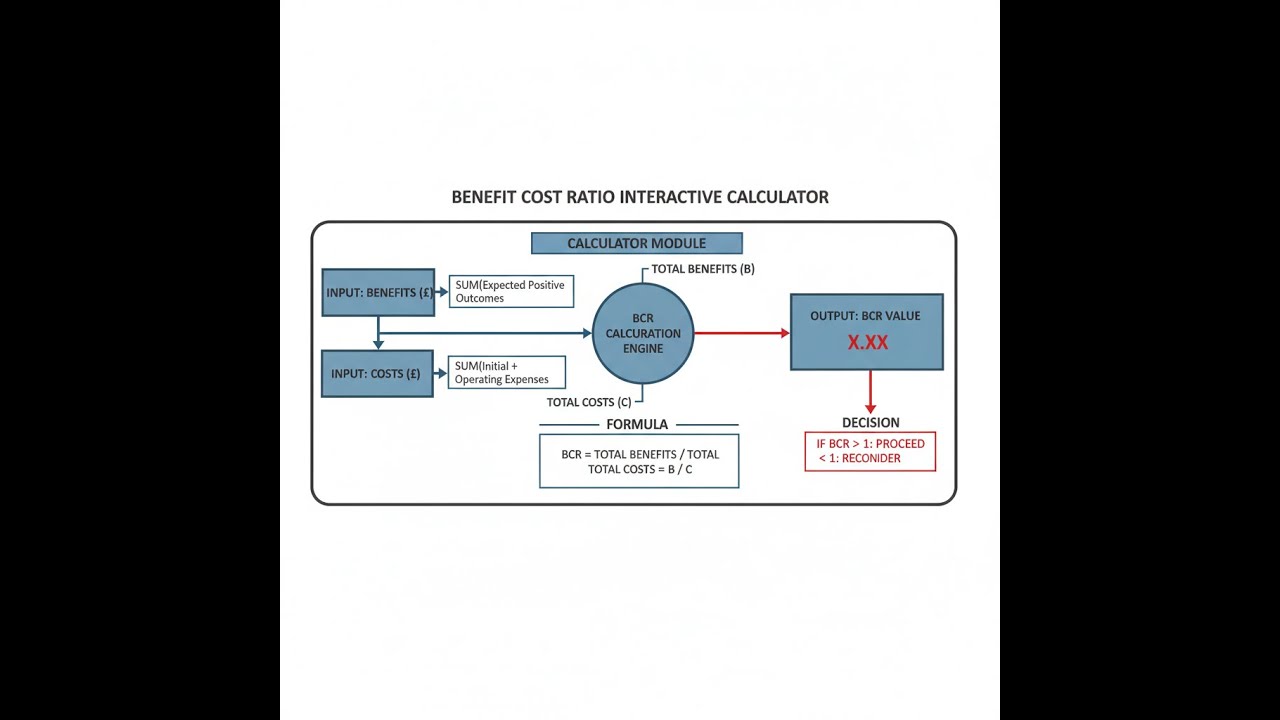
Visual Diagram

Benefit Cost Ratio Calculator
How to Use This Calculator
This calculator is intended for education, concept evaluation, and preliminary design. Results are based on the equations and assumptions described on this page, but cannot account for every real-world load case, tolerance, material property, environmental condition, installation detail, safety factor, code, or regulatory requirement. Verify all inputs, assumptions, units, and results independently before selecting components or using the result in a real application. Safety-critical, structural, medical, lifting, transportation, or regulated applications must be reviewed by a qualified engineer.
- Pick your Calculation Mode in the dropdown. "Basic BCR" covers the straightforward ratio; "Present Value" is for multi-year projects with a discount rate.
- Fill in the benefits and costs shown based on the mode you picked.
- If you’re in Present Value or Break-Even mode, also enter Project Life (years) and Discount Rate (%).
- Hit Calculate to get your results.
Benefit Cost Ratio Interactive Visualizer
See how benefit cost ratio changes with project parameters in real-time. Watch the visual breakdown of benefits vs costs and understand when projects become economically viable.
BCR
1.67
NET BENEFIT
$200K
DECISION
ACCEPT
FIRGELLI Automations — Interactive Engineering Calculators
Key Equations
Use the formula below to calculate the Benefit Cost Ratio.
Basic Benefit Cost Ratio
Where:
- BCR = Benefit Cost Ratio (dimensionless)
- B = Total Benefits ($)
- C = Total Costs ($)
Present Value BCR
Where:
- PV(Benefits) = Present Value of all future benefits ($)
- PV(Costs) = Present Value of initial investment plus operating costs ($)
Present Value Calculation
Where:
- CFt = Cash flow in year t ($/year)
- r = Discount rate (decimal)
- t = Time period (years)
Net Benefit
Where:
- NB = Net Benefit ($)
- B = Total Benefits ($)
- C = Total Costs ($)
Incremental BCR
Where:
- BB = Benefits of Project B ($)
- BA = Benefits of Project A ($)
- CB = Costs of Project B ($)
- CA = Costs of Project A ($)
Decision Criteria
- BCR > 1.0: Benefits exceed costs → Accept project
- BCR = 1.0: Benefits equal costs → Break-even (marginal)
- BCR < 1.0: Costs exceed benefits → Reject project
Simple Example
A facility spends $200,000 on a process upgrade that returns $300,000 in savings over its life.
- Total Benefits: $300,000
- Total Costs: $200,000
- BCR = $300,000 / $200,000 = 1.50
- Result: BCR > 1.0 — project is economically viable. Every dollar spent returns $1.50.
Theory & Engineering Applications
BCR came into mainstream use because engineers needed a way to justify big spending—starting with water projects—by showing quantifiable benefits were greater than costs. That idea spread into everything from highways to manufacturing to environmental work.
Theoretical Foundation and Economic Principles
BCR tries to put real value on time: money now is worth more than the identical amount received later, which is why you discount future returns. The discount rate matters more than many realize: a typical public project uses a 3–7% rate, while private investments can run 8–15% due to higher risk or cost of capital.
BCR alone doesn’t capture project scale: compare a small job with a high BCR and a big project with a lower BCR but much more total benefit—the larger project might create more value for the money, even if the ratio is lower. Always check NPV and IRR too, not just BCR, especially if you’re weighing large mutually exclusive options.
Present Value Discounting Mechanics
Discounting cuts future cash flows down quickly. With a 5% discount rate over 20 years, a dollar earned in year 20 is worth just 37.7 cents today. For major assets (bridges, water plants) with long lives, future benefits shrink fast when discounted, so it’s important to model ongoing maintenance, performance degradation, and realistic benefit streams. If you ignore these, BCR may look much higher than it should.
Some projects—especially ones with long horizons, like environmental work—use decreasing discount rates over time to avoid undervaluing far-future benefits. Most projects just use a constant rate, but if your project affects future generations, consider if that’s the best approach.
Incremental Analysis in Comparative Evaluation
When picking between options, incremental BCR matters more than each project’s separate BCR. You don’t just pick the project with the highest BCR; you check if the extra cost of the next-better alternative gets you extra benefit—specifically, if the added benefit per extra dollar spent is over 1.0. Engineers often get this wrong and end up with technically efficient but smaller projects that don’t actually generate the most value overall.
Industry-Specific Applications
For roads and bridges, BCR counts savings from less travel time, fewer accidents, and lower maintenance against project costs. Groups like AASHTO provide dollar values for things like safety and time—these don’t come from thin air, they're standardized estimates, for example, valuing a statistical life or a minute saved per trip.
In manufacturing, you use BCR to evaluate automation projects: labor savings, better quality, throughput, and safety pile up on the benefit side. But don’t forget ongoing maintenance and upgrades—these can make high BCRs look achievable on paper, but real upkeep cuts into returns.
Environmental BCRs can include things like reduced illness, compliance with pollution laws, or improvements to ecosystems. A lot of these rely on rough estimates—there are published ranges for value of life or clean air, but make sure you note sources and accept there’s always considerable uncertainty here.
Energy project BCRs—like solar or wind—change as technology prices move. Module prices for solar have dropped significantly, swinging BCRs upward for new installations, especially if carbon cost is factored in. It’s worth noting those external costs (like emissions) can shift the numbers a lot and aren’t always universally agreed on.
Comprehensive Worked Example: Industrial Wastewater Treatment System
A plant is weighing installing a membrane bioreactor (MBR) for wastewater recycling. Here’s how to break it down using BCR.
Given Parameters:
- Initial investment: $2,750,000
- Annual operating: $385,000
- Current water cost: $4.85/1,000 gal
- Current wastewater fee: $6.20/1,000 gal
- Water savings: 95 million gal/year
- Punitive fines avoided: $125,000/year
- Discount rate: 9.5%
- Design life: 18 years
- Salvage: $220,000
Solution Process:
Step 1: Annual Benefits
Water saving: 95 million × $4.85/1,000 = $460,750
Discharge fees: 95 million × $6.20/1,000 = $589,000
Fines avoided: $125,000
Total: $1,174,750/year
Step 2: PV of Benefits
PV annuity at 9.5% for 18 years:
PV(Benefits) = $1,174,750 × [(1 - (1.095)-18) / 0.095] = $1,174,750 × 8.4814 = $9,964,535
Add salvage, discounted: $220,000 / (1.095)18 = $42,788
Total PV(Benefits) = $10,007,323
Step 3: PV of Costs
Upfront: $2,750,000
Ongoing: $385,000 × 8.4814 = $3,265,339
Total PV(Costs) = $6,015,339
Step 4: Calculate BCR
BCR = $10,007,323 / $6,015,339 = 1.664
Step 5: Results
NPV = $10,007,323 - $6,015,339 = $3,991,984
With BCR = 1.664 (>1.0), benefits are comfortably ahead of costs. NPV is also solid. If you raise the discount rate to 12%, BCR tightens to 1.545. Always check how sensitive your answer is to discount rate changes, especially for long-life equipment.
Risk and Uncertainty Considerations
Most BCR calculations assume you know future costs and benefits exactly. This is rarely true. If you want to account for possible changes in cash flows, try using Monte Carlo simulation—model your numbers as distributions, not just points, and look at the chance BCR actually drops below 1.0. A higher average BCR with a wide range of possible outcomes can be riskier than a lower but steadier result.
Add options when you have the flexibility to delay, stage, or expand a project. Classic BCR doesn’t capture this, but it can be important for infrastructure where you might build out in phases if demand grows, for example. Waiting or scaling options have value that basic BCR won’t catch.
For more engineering and financial calculators, see the full calculator library.
Practical Applications
Scenario: Municipal Bridge Replacement Decision
Marcus, working for a city, needs to justify a $12.3 million bridge replacement. The current bridge burns $420,000 in repairs every 18 months and sends trucks on long detours. Using the BCR calculator, he sums up direct savings (maintenance, transport costs, accident reduction, emergency response). Over a 75-year life and 4.5% discount rate, BCR comes out to 2.38. This clear ratio, plus a $16.7 million NPV, gets his project funded and lined up for grants. Most decisions like this are less about theory and more about showing numbers clearly and defensibly.
Scenario: Manufacturing Automation Investment
Jennifer reviews replacing manual assembly with cobots. It costs $847,000 upfront, cuts labor by $365,000 each year, improves quality ($127,000 less scrap) and cuts injury costs ($48,000/year). Using her company’s 11% discount rate and a 12-year timeline, BCR is 1.67. Comparing with a fully automated cell for $1.2 million, she checks incremental BCR—extra investment earns too little benefit (BCR 0.84), so she sticks with cobots. This is typical: the cheaper upgrade delivers more bang per buck; overspending on automation can hurt overall returns. Run the numbers before leaping to high-tech.
Scenario: Energy Efficiency Retrofit Analysis
Carlos, at a university, proposes new lighting, HVAC, and insulation for 23 buildings. Costs are $2.87 million, with combined annual savings (utilities, reduced maintenance, carbon credits) over $786,000. At a conservative 6.5% discount rate and a 22-year plan, BCR is 1.94. This persuades both fiscal and sustainability decision-makers, secures funding, and pays for future upgrades. Again, the focus is on clear, defensible numbers and reasonable assumptions—the main value of BCR in practice.
Frequently Asked Questions
Free Engineering Calculators
Explore our complete library of free engineering and physics calculators.
Browse All Calculators →🔗 Explore More Free Engineering Calculators
About the Author
Robbie Dickson — Chief Engineer & Founder, FIRGELLI Automations
Robbie Dickson brings over two decades of engineering expertise to FIRGELLI Automations. With a distinguished career at Rolls-Royce, BMW, and Ford, he has deep expertise in mechanical systems, actuator technology, and precision engineering.
Video Walkthrough - How to Use This Calculator
Need to implement these calculations?
Explore the precision-engineered motion control solutions used by top engineers.


