Getting your production speed matched up with actual customer demand can look straightforward on paper. But once your line starts slipping and orders stack up, the reality sets in. This Takt Time Production Calculator gives you a clear way to figure out the pace you need, the number of operators required, and how balanced your line is. Plug in shift time, demand, work content, and station details—you’ll spot bottlenecks before they cost you. This tool is right at home in lean manufacturing, vehicle assembly, and electronics lines. Further down, you’ll find the core formula, a worked example, some plain talk on line balancing, practical realities with mixed products, and a focused FAQ.
What is Takt Time?
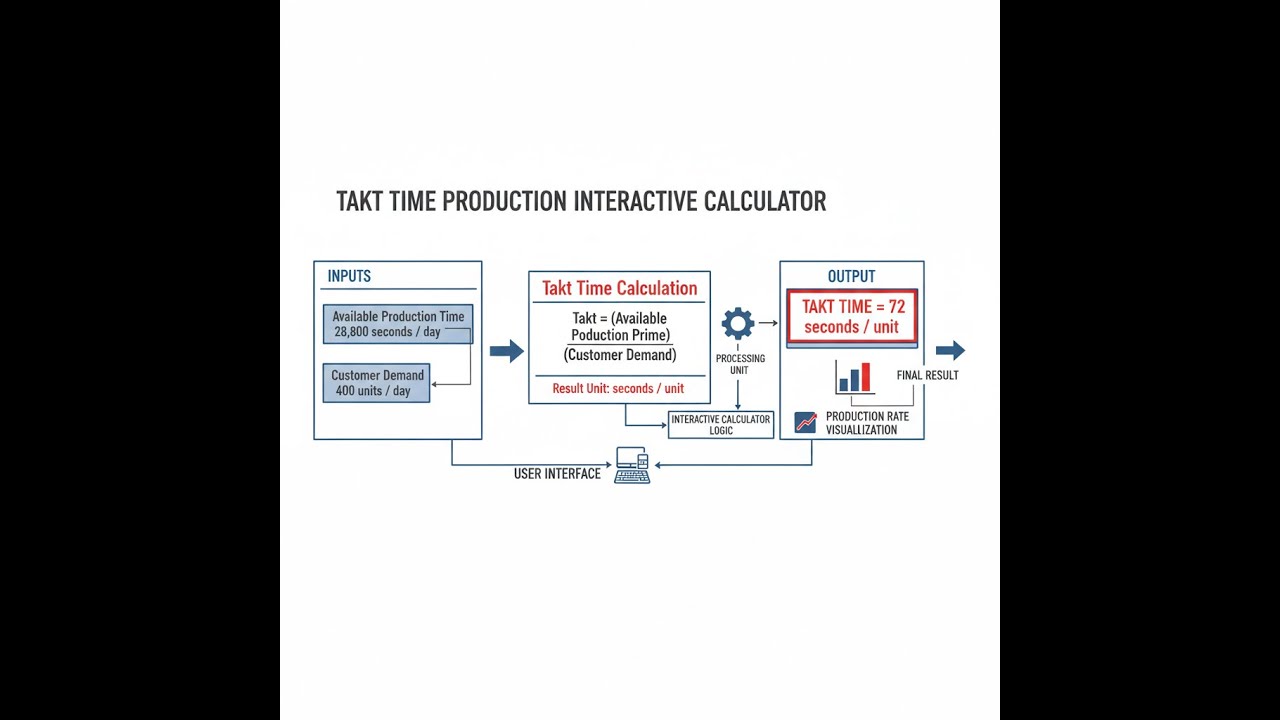
Takt time is the maximum time you’re allowed for each unit if you want to keep up with customer demand. Get it by dividing your available production time by the number of units customers want during that period. Simple equation, but a key constraint.
Simple Explanation
Takt time works like a regular beat—a metronome for production. Every time you hit that interval, another finished unit comes off the line. Take longer and you fall behind; work faster and you end up building inventory nobody ordered, which lean systems try to avoid.
📐 Browse all 1000+ Interactive Calculators
Visual Diagram

Takt Time Production Calculator
How to Use This Calculator
This calculator is intended for education, concept evaluation, and preliminary design. Results are based on the equations and assumptions described on this page, but cannot account for every real-world load case, tolerance, material property, environmental condition, installation detail, safety factor, code, or regulatory requirement. Verify all inputs, assumptions, units, and results independently before selecting components or using the result in a real application. Safety-critical, structural, medical, lifting, transportation, or regulated applications must be reviewed by a qualified engineer.
- Select your calculation mode from the dropdown — choose from takt time, required units, available time, cycle time comparison, operator count, or line balance efficiency.
- Enter the available production time per shift in minutes and your customer demand in units per shift (or whichever inputs appear for your selected mode).
- If calculating operators or line balance, also enter total work content in seconds and the relevant station data.
- Click Calculate to see your result.
Takt Time Production Interactive Visualizer
Adjust the sliders and see how quickly production pace, headcount, and efficiency move. Takt and cycle time don’t always line up in practice—this tool shows you, visually, where things drift.
TAKT TIME
90 sec
OPERATORS
3
EFFICIENCY
100%
STATUS
OK
FIRGELLI Automations — Interactive Engineering Calculators
Takt Time Equations
Here’s the basic formula for takt time.
Core Takt Time Formula
Where:
- Takt Time = Maximum time allowed per unit (typically seconds or minutes)
- Available Production Time = Net operating time minus planned downtime (breaks, maintenance)
- Customer Demand = Required number of units per time period
Here’s how to estimate how many operators you’ll need.
Required Operators Formula
Where:
- Total Work Content = Sum of all task times required to complete one unit (seconds)
- Result is rounded up to the nearest whole number of operators
Here’s how you check if your line’s efficiency is as good as it looks on paper.
Line Balance Efficiency Formula
Where:
- Bottleneck Time = Time at the slowest workstation (determines line speed)
- Ideal efficiency approaches 100% when all stations have equal cycle times
- Balance Loss = 100% - Line Balance Efficiency
Production rate comes straight from takt time, using this equation.
Production Rate Formula
Where:
- 3600 = Number of seconds in one hour
- Takt Time must be expressed in seconds for this calculation
Compare your actual cycle time to your takt time to see if you’re keeping up.
Cycle Time vs Takt Time Comparison
Where:
- Cycle Time = Actual time to complete one unit at a workstation
- Meeting Demand: Cycle Time ≤ Takt Time (production keeps pace)
- Falling Behind: Cycle Time > Takt Time (production cannot meet demand)
Simple Example
Say you’ve got 450 minutes per shift and customers want 300 units. Multiply 450 by 60, divide by 300, and you get a takt time of 90 seconds per unit.
You need a finished unit every 90 seconds. If total work content is 270 seconds, you’ll need 3 operators (270 ÷ 90 = 3).
Theory & Engineering Applications
Takt time comes from the German word for rhythm—and the name fits. It’s a core principle in lean. Takt isn’t the same as cycle time. Takt is the requirement, set by customers; cycle time is what your process actually achieves. Takt time anchors the line to what the market truly needs. Get it right and you move from building for a forecast to building only for demand. That stops overproduction at the root.
Fundamental Principles of Takt Time
The math is basic: production time divided by demand gives you a heartbeat for every operation in the plant. With 450 minutes and a need for 300 units, the takt’s 90 seconds per part. Any station taking longer is a bottleneck and needs to be fixed if the target’s going to be hit.
But takt time isn’t a goal—it's a ceiling. Running a process under the takt (meaning faster) can be helpful if you need to build a little inventory for later maintenance windows or other interruptions. But steady overproduction just clogs your system. Most plants aim for cycle times at 85-95% of takt, leaving a small buffer for natural swings in process output but not going too far.
Available Time Calculation Nuances
Available production time is more than total shift minus breaks. You need to cleanly separate planned downtime (breaks, scheduled maintenance, changeover) and unplanned downtime (random stops, shortages, defects). Only subtract planned downtime when you calculate available time for takt. Leave unplanned downtime out of the equation—otherwise you end up designing your system to tolerate bad habits and missed maintenance goals.
If your plant runs two 8-hour shifts, two 15-minute breaks, and a half-hour lunch per shift, gross time is 960 minutes. Subtract the planned downtime (breaks and changeovers) and you’re left with what’s actually available. If you’re tempted to subtract unplanned downtime, resist—takt should make those problems visible, not wash them into the baseline.
Line Balancing and Workstation Distribution
Once takt is known, the actual work starts: you have to split up the work so no single station runs over the takt limit. Line balancing isn’t a one-and-done job. In reality, equipment limits and dependencies mean you rarely hit perfect balance. You'll probably round up the number of operators—it's better to run a bit loose than risk chronic bottlenecks.
Measure your line balance by checking theoretical minimum against reality. A line balance efficiency under 90% means there’s idle time baked in somewhere. Big operations might squeeze out 92-95%; smaller batch jobs might be fine with 80-85% and adjust balance as mix changes.
Multi-Model Production Complexity
It’s rare that a plant builds only one product, so product mix makes things trickier. If you’re mixing products with different cycle times, weigh each one by its share of volume to find a weighted average for staffing and line pace. There’s no shortcut—a single takt time won’t fit when your mix or cycle times change often.
The best way is to level-load your sequence (heijunka). Instead of batching long runs of one product, alternate short intervals of each, so the workload and station times average out. This keeps material and staff moving rather than swinging from idle to backup.
Worked Example: Assembly Line Design
Here’s a real setup for an electronic assembly line:
- Daily customer demand: 720 units
- Operating schedule: Two 7.5-hour shifts per day
- Planned breaks: 30 minutes per shift (two 15-minute breaks)
- Shift changeover: 15 minutes
- Total work content per unit: 385 seconds
Step 1: Calculate available production time per day
Gross time = 2 × 7.5 × 60 = 900 minutes Remove planned downtime: 2 × (30 + 15) = 90 minutes Available production time = 900 - 90 = 810 minutes = 48,600 seconds
Step 2: Calculate takt time
Takt = 48,600 seconds ÷ 720 units = 67.5 seconds per unit
One unit should exit every 67.5 seconds if you want to keep up.
Step 3: Determine theoretical number of operators
Operators (theoretical) = 385 ÷ 67.5 = 5.70 → You need to round up, so call it 6.
Step 4: Calculate line balance efficiency
Efficiency = 385 ÷ (6 × 67.5) × 100% = 95.1%. The closer you get to 100%, the less waste in waiting and idle operator time.
Step 5: Design workstation allocation
Distribution example (targeting ≤67.5s per station):
- Station 1: 62 seconds
- Station 2: 67 seconds
- Station 3: 65 seconds
- Station 4: 66 seconds
- Station 5: 63 seconds
- Station 6: 62 seconds
Maximum time per station here is 67s (below takt). That’s a balanced line with very little waste.
Step 6: Validate production capacity
If every station holds, you’ll make slightly more than required: 48,600 ÷ 67 ≈ 725 units. That leaves just enough wiggle room.
Common Implementation Pitfalls
Don’t confuse takt time—line-wide constraint—with any individual process or machine time. Some equipment works faster than takt (for example, presses often run in batches)—what matters is the output over time matches tactically what’s needed.
Takt changes as demand changes—you can’t “run faster” without rebuilding your staffing and maybe your equipment too. Watch out for demand drops too: keeping the old pace only builds up unnecessary stock.
Takt time and inventory are linked, but “just-in-time” doesn’t mean zero inventory everywhere. You’re aiming for just enough buffer where needed to keep the system running even with inevitable disruptions, but not hiding waste in big piles of extra parts. Make buffer inventory purposeful and visible.
Integration with Overall Equipment Effectiveness (OEE)
Pairing takt time with OEE can tell you whether slippage is down to cycles being too slow, downtime, or scrap rates. If a machine can’t beat your takt, you won’t make quota unless you add parallel lines or buffer upstream. Do this check before you lock in your automation investment—or live with a built-in bottleneck you paid extra for.
Takt time should inform every decision on automation speed and reliability—get this right up front, not after you’ve bought equipment. If you’re designing new automation, match cell cycle time against takt as your first engineering check.
For more ways to analyze your production math, check out the full calculator library on manufacturing and operations topics.
Practical Applications
Scenario: Electronics Assembly Line Optimization
In this case, a manufacturer keeps missing delivery dates even with two shifts putting out 850 units against a demand of 920. With 870 production minutes available, the takt’s 56.7 seconds. The real bottleneck is the test station at 64 seconds. The math says they’re losing efficiency (about 78%). By offloading the test work and splitting it across fixtures, they get max station time down to 54 seconds. That’s a jump to 93% efficiency, and now output climbs above the minimum needed—problem solved for now.
Scenario: Automotive Parts Staffing Decision
A Tier 2 auto supplier gets a new contract for 1,440 brake assemblies daily. Tradition says 10 operators is standard, but the budget allows for only 8. Working backwards, with 960 minutes per shift and work content at 290s per unit, the takt comes out to 40 seconds per unit. The math shows 8 will cover it at roughly 91% balance. By actually walking the line and adjusting task distribution, the line hits both target pace and improves work quality—it wasn’t a matter of working harder, just working smarter and getting rid of baked-in delays.
Scenario: Seasonal Demand Adjustment
Here, a food packager has wild swings in demand—peak season doubles daily requirements. The approach is simple: recalculate takt time whenever the season flips, and staff accordingly. Off-season, the takt is higher (slower), covering the line with 4 operators; in peak, takt drops, and 8 are needed. Don’t keep staff idle or overstretched—just match your numbers to the math and push for flexibility with cross-training instead of maintaining year-round maximum staffing.
Frequently Asked Questions
▼ What is the difference between takt time, cycle time, and lead time?
▼ How often should takt time be recalculated in a real production environment?
▼ What should I do when cycle time exceeds takt time?
▼ How does product mix affect takt time calculations?
▼ Should unplanned downtime be included when calculating available production time?
▼ How does takt time relate to inventory management and buffer stock?
Free Engineering Calculators
Explore our complete library of free engineering and physics calculators.
Browse All Calculators →🔗 Explore More Free Engineering Calculators
About the Author
Robbie Dickson — Chief Engineer & Founder, FIRGELLI Automations
Robbie Dickson brings over two decades of engineering expertise to FIRGELLI Automations. With a distinguished career at Rolls-Royce, BMW, and Ford, he has deep expertise in mechanical systems, actuator technology, and precision engineering.
Video Walkthrough - How to Use This Calculator
Need to implement these calculations?
Explore the precision-engineered motion control solutions used by top engineers.


