If you’re not looking at Gauge R&R, your measurement system could be misleading you. When scrap spikes or your capability indices don’t add up, start by checking measurement variation—not just the process. This calculator offers a direct way to get equipment variation (EV), appraiser variation (AV), total GRR, %GRR, %Tolerance, and Number of Distinct Categories (NDC) from your test data. For industries where a wrong pass/fail costs serious time and money—like automotive, medical, or close-tolerance machining—getting these numbers right up front saves you grief later. You’ll find practical equations, a no-nonsense worked example, and details on where the math applies and where it can come up short.
What is Gauge R&R?
Gauge R&R (Repeatability and Reproducibility) is a straightforward approach for figuring out what proportion of your measurement variation is due to the measurement setup—both the device and the people using it—rather than variation between your actual parts. If your gauge error is too high, your inspection results aren’t reliable, period.
Simple Explanation
Let’s say you measure the same bolt with the same caliper ten times and the numbers aren’t quite the same each run—that's your repeatability error. Now, if two operators pick up that caliper and keep getting slightly different numbers on the same part every time, that's your reproducibility error. Gauge R&R puts a value to both, giving you a clear signal on whether you can trust your measurement process or need to address it first.
📐 Browse all 1000+ Interactive Calculators
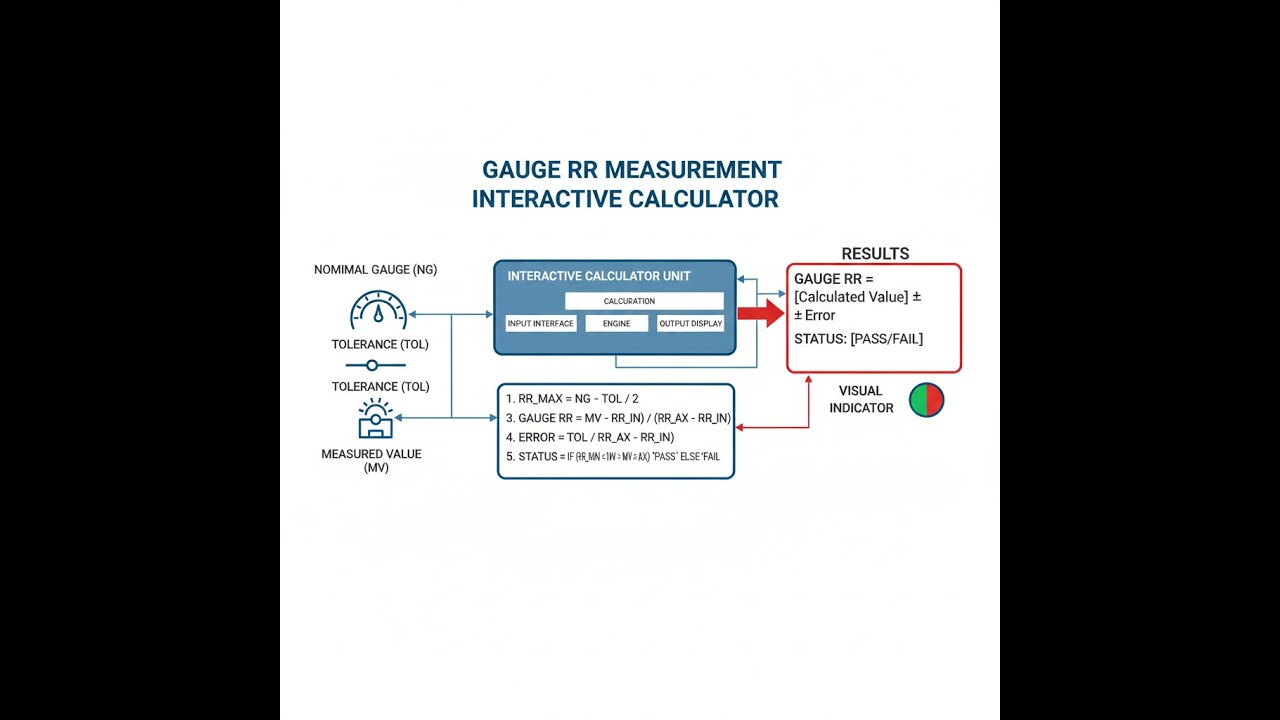
Visual Diagram

Gauge R&R Interactive Calculator
How to Use This Calculator
This calculator is intended for education, concept evaluation, and preliminary design. Results are based on the equations and assumptions described on this page, but cannot account for every real-world load case, tolerance, material property, environmental condition, installation detail, safety factor, code, or regulatory requirement. Verify all inputs, assumptions, units, and results independently before selecting components or using the result in a real application. Safety-critical, structural, medical, lifting, transportation, or regulated applications must be reviewed by a qualified engineer.
- Pick your Calculation Mode: Standard, ANOVA, Percent Tolerance, NDC, or Acceptance Criteria.
- Input your EV, AV, PV, and Spec Tolerance (for Standard mode), or ANOVA values for the ANOVA approach. Make sure everything’s in the same units as your original measurements.
- Double-check all values are positive and match your real study units.
- Hit Calculate and review your results.
gauge r&r measurement interactive visualizer
Watch how changing equipment variation (EV) and appraiser variation (AV) alters total gauge R&R. See for yourself how these variables affect %GRR—and at what point your measurement system is no longer giving you actionable information about actual parts.
GAUGE R&R
0.025
%GRR
38.5%
TOTAL VAR
0.065
STATUS
POOR
FIRGELLI Automations — Interactive Engineering Calculators
Gauge R&R Equations
Use the formula below to calculate Gauge R&R (GRR).
Gauge R&R (GRR) Calculation
GRR = √(EV² + AV²)
Where:
GRR = Gauge Repeatability and Reproducibility
EV = Equipment Variation (repeatability)
AV = Appraiser Variation (reproducibility)
Use the formula below to calculate Total Variation (TV).
Total Variation (TV)
TV = √(GRR² + PV²)
Where:
TV = Total Variation
PV = Part Variation (part-to-part variation)
Use the formula below to calculate Percent GRR of Total Variation.
Percent GRR of Total Variation
%GRR = (GRR / TV) × 100%
Acceptance Criteria:
%GRR less than 10% = Acceptable
%GRR 10-30% = Marginal (may be acceptable)
%GRR greater than 30% = Unacceptable
Use the formula below to calculate Percent of Tolerance.
Percent of Tolerance
%Tolerance = (6 × GRR / Tolerance) × 100%
Where:
Tolerance = Upper Specification Limit minus Lower Specification Limit
The factor 6 represents ±3 standard deviations (99.73% coverage)
Use the formula below to calculate Number of Distinct Categories (NDC).
Number of Distinct Categories (NDC)
NDC = ⌊1.41 × (PV / GRR)⌋
Where:
⌊ ⌋ = Floor function (round down to nearest integer)
NDC ≥ 5 is generally required for adequate discrimination
The factor 1.41 is √2, accounting for measurement system resolution
Use the formula below to calculate Equipment Variation using the ANOVA method.
ANOVA Method - Equipment Variation
EV = (R̄ / d2) × K1
Where:
R̄ = Average range across all operators and trials
d2 = Control chart constant (depends on number of trials)
K1 = Study variation constant (typically 5.15 for 99% confidence)
Simple Example
Given: EV = 0.010, AV = 0.010, PV = 0.050, Specification Tolerance = 0.200
GRR = √(0.010² + 0.010²) = √(0.0002) ≈ 0.0141
TV = √(0.0141² + 0.050²) ≈ 0.0519
%GRR = (0.0141 / 0.0519) × 100% ≈ 27.2% — marginal system, investigate before relying on it for final inspection.
NDC = ⌊1.41 × (0.050 / 0.0141)⌋ = ⌊5.0⌋ = 5 — barely adequate discrimination.
Theory & Engineering Applications
Fundamental Principles of Measurement System Analysis
Gauge R&R is a practical way to see if your measurement process is actually telling you about your parts, or if it’s just picking up noise from equipment or operator habits. Repeatability is about the gage itself—will it read the same value if you measure the same part, the same way, several times in a row? Reproducibility is what changes when someone else takes those measurements. If you know which is causing problems, you know where to look next: machine maintenance for repeatability, procedures and training for reproducibility.
Practically, the trick is separating real part variation from noise. Nobody expects zero measurement error. If the measurement system accounts for less than about 10% of observed variation, most of the signal you’re seeing is due to the parts themselves, which is workable for most shop-floor decisions. These limits—10%, 10-30%, and over 30%—aren’t set in stone, but they’re grounded in common sense and reflect what’s been feasible in various industries over decades. Don’t fall into the trap of assuming low %GRR always means your system is “good,” though. If you stacked your study with parts covering the full spec range, or if your process is unusually tight, you can get a %GRR that isn’t accurate for real-world production.
ANOVA Method vs. Range Method
There are two main ways you’ll see GRR numbers calculated. The X̄-R (average and range) method is the fast and dirty option—it uses the spread in your data and a few constants to spit out the numbers. For most routine plant checks, this does the job and you don’t need advanced stats. The ANOVA method takes things farther, breaking out how much variation comes from part-operator interactions—like if certain parts always trip up specific operators. If you’re working in environments where precision is critical and features are tricky to check (think medical, high-end machining, or semiconductors), you’ll want to dig into ANOVA. Sometimes these deeper dives reveal that the gage is fine, but the part feature or setup introduces most of your headaches.
Number of Distinct Categories and Resolution
NDC (Number of Distinct Categories) gives you a practical handle on how “usable” your measurement system actually is. NDC = 5 or above means you can tell at least five meaningful differences among your parts—that’s enough to make process control decisions that matter. Don’t be fooled by digital gages that go out to a bunch of decimals if the consistency isn’t there; a 0.0001” display doesn’t help if real repeatability is only ±0.001”. You’re better off with less “resolution” on the screen and better underlying consistency in your readings. Before buying better equipment, fix your basics first.
Worked Example: Shaft Diameter Measurement System
Say you’re at a plant making shafts for gearboxes with a nominal 25.000 mm diameter, ±0.050 mm tolerance (total tolerance = 0.100 mm). Three operators each measure ten shafts three times. Here’s what you get after crunching the data:
Given Data:
- Equipment Variation (EV) = 0.0087 mm
- Appraiser Variation (AV) = 0.0065 mm
- Part Variation (PV) = 0.0423 mm
- Specification Tolerance = 0.100 mm
Step 1: Calculate Gauge R&R (GRR)
GRR = √(EV² + AV²) = √(0.0087² + 0.0065²) = √0.00011794 = 0.01086 mm
Step 2: Calculate Total Variation (TV)
TV = √(GRR² + PV²) = √(0.01086² + 0.0423²) = √0.001907 = 0.04367 mm
Step 3: Calculate %GRR of Total Variation
%GRR = (0.01086 / 0.04367) × 100% = 24.87%
Step 4: Calculate Individual Component Percentages
%EV = (0.0087 / 0.04367) × 100% = 19.92%
%AV = (0.0065 / 0.04367) × 100% = 14.89%
%PV = (0.0423 / 0.04367) × 100% = 96.88%
These don’t add to 100% because you’re working with ratios of standard deviations, not simple sums. Double-check by squaring and adding %EV and %AV: √(19.92² + 14.89²) = 24.88%, which matches GRR.
Step 5: Calculate %Tolerance
%Tolerance = (6 × 0.01086 / 0.100) × 100% = 65.16%
Step 6: Calculate Number of Distinct Categories (NDC)
NDC = ⌊1.41 × (0.0423 / 0.01086)⌋ = 5
Interpretation: With %GRR at 24.87%, the system sits in the “marginal” zone. NDC gives you 5 groups, which is workable. The kicker is EV is higher than AV, so before blaming operators, make sure the gage and fixturing are solid. With %Tolerance of 65%, you’re eating up a chunk of tolerance just with measurement error; that will distort true process capability. For stuff going to final inspection or Cpk reporting, this measurement setup is not ideal.
Recommended Actions: Decide if this is good enough based on what you’re doing. If it’s just in-process trending and you’re not using this gage for customer reports, it might fly. For final inspection, Cpk, or customer releases, address the equipment repeatability before wasting resource on operator retraining. Tighten up gage mounting, check for temperature drift, or upgrade the sensor itself if needed.
Application Across Industries
In pharma, Gauge R&R is used to check analytical instruments for dosage or composition. Here, expectations are more strict—often below 5%—since you want as little added noise as possible. In aerospace, running Gauge R&R on CMMs can expose surprises: operators using slightly different setup routines or datum schemes can make reproducibility worse than any equipment shortcoming. For electronics, especially with AOI or manual visual checks, reproducibility often swamps repeatability; people simply don’t make identical judgments on borderline cases. In these settings, moving to fully automated inspection can produce better, more repeatable numbers—just be prepared for the reality that machines don’t fix fixturing or environmental issues by themselves.
Practical Applications
Scenario: Quality Manager Validating New CMM Investment
Jennifer, working quality at a precision machine shop, gets a new $175k CMM. She runs a GRR study before releasing it for production. Three operators measure 10 sample parts three times each. Results: Equipment Variation 0.0034 mm, Appraiser Variation 0.0019 mm, Part Variation 0.0521 mm. Calculator returns %GRR 7.5%, NDC 13. Conclusion: the CMM can reliably tell parts apart in this process, so Jennifer includes the study in the quality manual. Low operator influence is a good sign—saves wasted time blaming people when the process changes. Most of the variation comes from the parts—not the gage or the people, so she knows she’s measuring what matters.
Scenario: Manufacturing Engineer Troubleshooting High Scrap Rates
Carlos, manufacturing engineering in molding, sees scrap rate jump when tolerances are tightened on a medical device. He suspects the gage, not the process, so he does a Gauge R&R study on the ultrasonic thickness tester. %GRR clocks in at 34%—the system just isn’t up for the job. Most of the variation is from the instrument, not the operator. Turns out the transducer is worn, and the calibration block isn’t appropriate for the range used. After fixing those, %GRR drops to 12%, scrap drops, and the spend to upgrade the gage is paid back within a few weeks, just by not scrapping good parts anymore.
Scenario: Six Sigma Black Belt Preparing for DMAIC Project
Marcus, doing Six Sigma work, wants to raise bearing housing Cpk from 0.87 to 1.33. First thing, he runs Gauge R&R on the three-point bore gage being used for the key measurement. Marginal results: %GRR 18% and NDC only 4. That means the Cpk is underreported due to measurement error. He figures out that just upgrading to an air gage with better repeatability would bring the “true” Cpk up—cheaper than process overhaul. The data lets him build a real economic argument for where to spend first, rather than blindly chasing capability through process tweaks.
Frequently Asked Questions
Free Engineering Calculators
Explore our complete library of free engineering and physics calculators.
Browse All Calculators →🔗 Explore More Free Engineering Calculators
About the Author
Robbie Dickson — Chief Engineer & Founder, FIRGELLI Automations
Robbie Dickson brings over two decades of engineering expertise to FIRGELLI Automations. With a distinguished career at Rolls-Royce, BMW, and Ford, he has deep expertise in mechanical systems, actuator technology, and precision engineering.
Need to implement these calculations?
Explore the precision-engineered motion control solutions used by top engineers.


