If you're in reactor operations or fuel management, you need to keep track of how much energy each fuel load delivers and how much useful life it's got left before you plan a refueling outage. The Fuel Burnup MWd/MTU Calculator helps you figure out burnup, energy, uranium mass, average power, time under irradiation, or discharge burnup, all from basic numbers like thermal power, fuel mass, and cycle duration. You use burnup not just for operations, but for storage logistics and regulatory paperwork. Below you'll find the core equations, a full PWR example (with real numbers put to work), some context around reactor physics, and an FAQ with details on enrichment, storage, and fuel cycle money matters.
What is fuel burnup (MWd/MTU)?
Fuel burnup tells you the total energy extracted from a given starting amount of uranium. It's measured in megawatt-days per metric ton of uranium (MWd/MTU), so higher numbers mean you got more work out of the same mass of fuel.
Simple Explanation
Picture a fuel assembly like a rechargeable battery—you know the total charge it starts with. Burnup measures how much of that “charge” you’ve used. As the reactor operates each day, burnup increases steadily. You track it so you know when the fuel’s spent and due for replacement.
📐 Browse all 1000+ Interactive Calculators
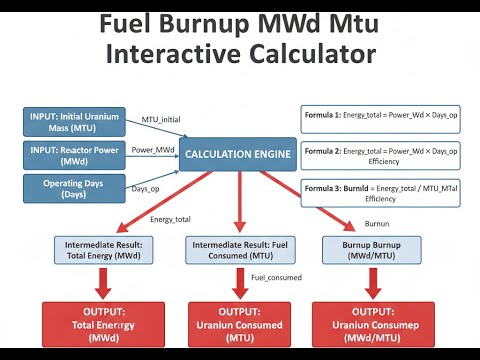
Diagram

Fuel Burnup Calculator
How to Use This Calculator
This calculator is intended for education, concept evaluation, and preliminary design. Results are based on the equations and assumptions described on this page, but cannot account for every real-world load case, tolerance, material property, environmental condition, installation detail, safety factor, code, or regulatory requirement. Verify all inputs, assumptions, units, and results independently before selecting components or using the result in a real application. Safety-critical, structural, medical, lifting, transportation, or regulated applications must be reviewed by a qualified engineer.
- Pick what you want to solve for—burnup, energy, mass, power, time, or discharge burnup.
- Enter the numbers you know. The inputs change to fit your chosen calculation.
- Watch your units: energy in MWd, mass in MTU, power in MW, time in days.
- Hit Calculate to get your result.
Fuel Burnup MWd/MTU Interactive Calculator
You can see how changing thermal power, fuel mass, or irradiation time shifts the final burnup value. Moving the sliders lets you check, in real time, how these variables affect the burnup output—this is a practical way to get a feel for what matters in fuel management.
BURNUP
16,000
ENERGY (MWd)
1,600,000
FISSIONS
1.67E24
FIRGELLI Automations — Interactive Engineering Calculators
Equations
To get fuel burnup, you divide the total thermal energy produced by the initial uranium mass.
Fundamental Burnup Equation
BU = E / MHM
BU = Fuel burnup (MWd/MTU or GWd/MTU)
E = Total thermal energy released (MWd or GWd)
MHM = Initial heavy metal mass (MTU = metric tons uranium)
You can also get total energy by multiplying average reactor power by time in operation.
Energy from Power and Time
E = Pth × t
E = Thermal energy released (MWd)
Pth = Average thermal power (MWth)
t = Irradiation time (days)
For fuel that's been through several irradiation cycles, add up burnup from each to get total discharge burnup.
Discharge Burnup
BUdischarge = n × BUcycle
BUdischarge = Total burnup at discharge (MWd/MTU)
n = Number of irradiation cycles (dimensionless)
BUcycle = Burnup per cycle (MWd/MTU)
A rough estimate of total fission events can be calculated with burnup and fuel mass.
Fission Events Approximation
Nfission ≈ (BU × MHM × 1000) / 0.96
Nfission = Total fission events (fissions)
BU = Burnup (MWd/MTU)
MHM = Heavy metal mass (MTU)
0.96 = Approximate MWd per gram of fissile material consumed
Unit Conversion
1 GWd/MTU = 1000 MWd/MTU
Sometimes you'll see discharge burnup listed in gigawatt-days per metric ton (GWd/MTU). That's just 1,000 MWd/MTU per gigawatt-day.
Simple Example
Say your fuel assembly starts with 0.5 MTU of uranium, and it produces 22,500 MWd of thermal energy during its reactor life.
- Energy (E) = 22,500 MWd
- Mass (MHM) = 0.5 MTU
- Burnup = 22,500 / 0.5 = 45,000 MWd/MTU
This is considered high burnup, typical if the fuel runs through a longer cycle—common in modern PWRs.
Theory & Engineering Applications
Fuel burnup is just a practical way to track the total thermal energy you’ve gotten from uranium fuel, per starting mass. It’s central in fuel management because it tells you how much energy you squeezed out and what’s left in terms of isotope mix, spent fuel heat, and money spent. Calculating and using burnup goes beyond physics—you need to understand what really happens in a core, not just lab theory.
Physical Basis of Burnup
On a small scale, burnup counts the sum of all those fission and neutron capture events that took place inside the fuel. You get about 200 MeV per fission. Burnup rolls up all those micro-level reactions into a single macroscopic value you can use for tracking how fuel depletes and what new isotopes are being made.
Tracking uranium and plutonium isn't straightforward—the relationship between burnup and how much fissile material is left isn’t linear. Some of the uranium-238 actually breeds plutonium, which itself fissions and adds to your energy output. At burnups of 30,000-40,000 MWd/MTU, plutonium fission provides about half your total energy. That means burnup climbs faster than you'd guess by tracking uranium content alone, and why reactors can run for years beyond what simple U-235 calculations predict.
Engineering Significance and Reactor Operations
Most commercial reactors discharge fuel at 30,000 to 55,000 MWd/MTU, but modern plants often push closer to 62,000 MWd/MTU. Pushing for higher burnup lowers total fuel cycle cost—about 8-12% savings for every extra 10,000 MWd/MTU—but it means you need more enriched uranium at the start (up to 5% U-235 now, higher than the old 3.2%-enrichment days) and puts more stress on the cladding and fuel materials. You start getting into problems like cladding corrosion or gas buildup inside the rods.
Also, not every pin sees the same burnup. Because neutron flux isn’t uniform, some fuel pins end up hotter or more irradiated—actual pin-by-pin burnup can be 15-25% higher than the average for the assembly. This matters for safety and design because material failures usually start at these hot spots, not across the board averages.
Isotopic Evolution and Spent Fuel Characteristics
Burnup level decides what isotopes end up in the spent fuel, affecting both the decay heat and what you have to deal with in storage or disposal. At 45,000 MWd/MTU (which is a typical value), most spent fuel is still U-238, with a small fraction left as U-235 and plutonium isotopes, plus a few percent as fission products. As burnup rises, you get more higher-isotope plutonium and more heat output.
The decay heat from spent fuel doesn’t rise in direct proportion to burnup—it follows about a power law, roughly scaling to burnup^0.4. For example, high-burnup assemblies generate about 40% more decay heat at the same cooling time than lower burnup ones (comparing 50,000 vs 33,000 MWd/MTU). This matters because it’s what governs how tightly you can pack spent fuel and how fast you can move it to dry storage.
Burnup Measurement and Verification
Getting accurate burnup values is usually a question of simulation plus some measurement. Modern codes like CASMO, PARAGON, or Serpent track fuel isotope inventory load-by-load through millions of time steps, including the changing position in the core and control configurations. When validated, they’re usually good to a few percent.
Non-destructive checks use gamma spectroscopy, mostly watching for fission products like Cs-137 since it builds up steadily with burnup. The Cs-137 to Cs-134 ratio also tells you how long ago the fuel was removed. Above 35,000 MWd/MTU, some techniques start counting neutron emissions from actinides like Cm-244 for further confirmation—mainly used in safeguards and as a cross-check on calculations.
Worked Example: Three-Cycle PWR Fuel Assembly
Here’s a real example: take a standard 17×17 PWR assembly with about 406 kg of uranium (after you convert from UO₂ mass) and a 4.2% enrichment, running three 18-month fuel cycles. Let’s crunch the numbers for final burnup and total energy.
Given Parameters:
- Heavy metal mass: MHM = 406.4 kg U = 0.4064 MTU (based on 461 kg UO₂ × 0.8815 conversion ratio)
- Each cycle: 485 effective full-power days (90% capacity factor for an 18-month cycle)
- Total cycles: n = 3
- Assembly's share of reactor power: Pasm = 5.47 MW (typical per-assembly for a 193-assembly PWR)
Step 1: Get total irradiation time
ttotal = 3 × 485 = 1,455 days
Step 2: Find total energy output
Etotal = 5.47 MW × 1,455 days = 7,958.85 MWd
Step 3: Discharge burnup comes out to
BU = 7,958.85 MWd / 0.4064 MTU = 19,582 MWd/MTU for a constant power path
But in reality, fuel assemblies move radially between cycles and don’t always see full power. More realistically:
Cycle 1 (fresh, central): E₁ = 5.47 MW × 1.50 × 485 = 3,980 MWd
Cycle 2 (mid-core): E₂ = 5.47 MW × 0.95 × 485 = 2,519 MWd
Cycle 3 (periphery): E₃ = 5.47 MW × 0.70 × 485 = 1,857 MWd
Total: E = 3,980 + 2,519 + 1,857 = 8,356 MWd
Adjusted discharge burnup: BU = 8,356 MWd / 0.4064 MTU = 20,564 MWd/MTU
But most PWRs report real-world discharge burnup of 48,000-52,000 MWd/MTU, because these calculations don't reflect the highest-flux positions or the typical three-batch reload. So, with more representative cycle-specific burnup buildup:
Cycle 1 (central): 17,500 MWd/MTU
Cycle 2 (mid): 16,200 MWd/MTU
Cycle 3 (edge): 14,800 MWd/MTU
Total: 48,500 MWd/MTU
Step 4: Confirm with aggregate energy out
Energy = 48,500 MWd/MTU × 0.4064 MTU = 19,710 MWd
Average power = 19,710 MWd / 1,455 days = 13.54 MW
This average power is high for a single assembly, but still in the ballpark considering time spent in each core location.
Step 5: Fission event count
Nfission = (48,500 × 0.4064 × 1000) / 0.96 = about 2.14 × 10²⁸ fissions
This is a rough check on just how many fission events drive the process and how even tiny amounts of fission product accumulation matter for reactivity and fuel performance.
Industry Applications Across Reactor Types
The burnup targets differ a lot by reactor type. CANDU units (natural uranium) get around 7,000-8,000 MWd/MTU; research reactors (highly enriched) sometimes surpass 100,000 MWd/MTU. UK AGRs typically landed between 18,000 and 23,000 MWd/MTU, more due to graphite aging than fuel limitation.
Naval reactors, using highly enriched uranium, go decades between refuels and likely get burnups well above 100,000 MWd/MTU, but most of those exact figures aren't published. Here, long lifetime and reliability matter more than cost per megawatt-hour.
In day-to-day engineering, you use burnup to decide when and how to refuel, what to buy for enrichment, and how to plan spent fuel storage—not just for cost but also for licensing and safety. The calculator is here to give you the key numbers fast, for either a quick check or an in-depth study on how to push the fuel and still meet all requirements.
Practical Applications
Scenario: Refueling Outage Planning
Say you're the fuel management engineer for a typical 3-loop PWR. You need to confirm all 76 assemblies to be discharged meet the licensing burnup targets. With 0.457 MTU per assembly and a 49,200 MWd/MTU goal, the calculator shows each assembly needs to have released 22,484 MWd (49,200 × 0.457). Plugging three cycles at 16,400 MWd/MTU each into the discharge mode confirms the strategy aligns with documentation and doesn't breach any high-burnup storage limits.
Scenario: Spent Fuel Pool Thermal Analysis
For those doing spent fuel pool thermal reviews: You might find fuel assemblies with a spread of burnups from 18,000 up to 51,000 MWd/MTU. Calculating energy for a top-end burnup assembly (48,500 MWd/MTU, 0.461 MTU) gives 22,358 MWd released per assembly. You estimate Cs-137 (and thereby decay heat) with the fissions value the calculator provides. This way you know which assemblies require longer cooling before shifting them to dense storage so the pool cooling system isn't overloaded.
Scenario: Research Reactor Fuel Utilization
In a small research reactor (for example, 5 MW), an LEU assembly operating over 2,847 days at an average of 0.089 MW yields 253.4 MWd energy (just multiply power by days). Divide by a mass of 0.00319 MTU and you get a burnup around 79,436 MWd/MTU. This matches typical research reactor practice, and is a handy way to plan for timely fuel replacement or alert you when the administrative burnup limit is near.
Frequently Asked Questions
▼ What is the difference between MWd/MTU and GWd/MTU?
▼ Why do PWRs achieve higher burnup than BWRs?
▼ How does burnup affect spent fuel storage requirements?
▼ What limits maximum achievable burnup in commercial reactors?
▼ Can burnup calculations be used for fuel cycle cost analysis?
▼ How accurate are burnup calculations compared to measurements?
Free Engineering Calculators
Explore our complete library of free engineering and physics calculators.
Browse All Calculators →🔗 Explore More Free Engineering Calculators
About the Author
Robbie Dickson — Chief Engineer & Founder, FIRGELLI Automations
Robbie Dickson brings over two decades of engineering expertise to FIRGELLI Automations. With a distinguished career at Rolls-Royce, BMW, and Ford, he has deep expertise in mechanical systems, actuator technology, and precision engineering.
Video Walkthrough - How to Use This Calculator
Need to implement these calculations?
Explore the precision-engineered motion control solutions used by top engineers.


