Balancing work-in-process and throughput is something you'll face in any real production or service setup. Fall too far on one side and you’re either waiting for material or swamped in unfinished work. This Throughput Little's Law Calculator lets you figure out throughput, WIP, cycle time, lead time, capacity, or utilization if you know any two of the main system variables. You can use this in factories, dev teams, healthcare, or call centers. Below you’ll find the actual equations, a step-by-step PCB assembly example, direct explanation of how Little’s Law works, and a FAQ listing mistakes people make.
What is Little's Law?
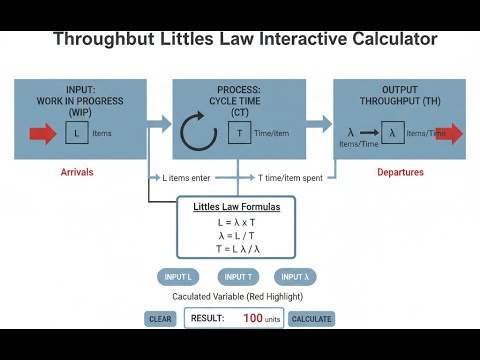
Little’s Law just ties together three things: the average number of items in your system (WIP), the average rate they go through (throughput), and how long each one stays (cycle time). If you have numbers for any two, you can get the third—no hand waving or fancy stats needed.
Simple Explanation
If you picture a highway, the number of cars on the road equals how often cars get on, times how long each car spends between the on-ramps and off-ramps. Put more cars in the same lane at the same speed, everything takes longer. That’s Little’s Law in plain terms—add stuff to the system but don’t increase your exit rate, and everyone waits longer. It works on factory floors, ERs, and even software backlogs because queues act the same everywhere.
📐 Browse all 1000+ Interactive Calculators
Table of Contents
System Diagram

Interactive Throughput Calculator
How to Use This Calculator
This calculator is intended for education, concept evaluation, and preliminary design. Results are based on the equations and assumptions described on this page, but cannot account for every real-world load case, tolerance, material property, environmental condition, installation detail, safety factor, code, or regulatory requirement. Verify all inputs, assumptions, units, and results independently before selecting components or using the result in a real application. Safety-critical, structural, medical, lifting, transportation, or regulated applications must be reviewed by a qualified engineer.
- Pick what you want to solve for (through the dropdown): Throughput, WIP, Cycle Time, Lead Time, Capacity, or Utilization.
- Fill in the two variables you actually know—like WIP and Cycle Time if you want throughput.
- Set the right time unit so your result means something.
- Hit Calculate and see the number.
Throughput Little's Law Interactive Visualizer
Visualize how Work-in-Process, Cycle Time, and Throughput interact according to Little's Law. Adjust any two variables to see immediate effects on system performance and capacity utilization.
THROUGHPUT
5.0/hr
UTILIZATION
83%
LEAD TIME
9.6 hrs
FIRGELLI Automations — Interactive Engineering Calculators
Equations & Formulas
If you need to get throughput, WIP, or cycle time, use these formulas. They’re direct and you’ll find them work in any stable system.
Little's Law (Fundamental Equation)
L = λ × W
L = Average number of items in the system (Work-in-Process, WIP) [items]
λ = Average arrival/throughput rate [items/time unit]
W = Average time an item spends in the system (Cycle Time) [time units]
Throughput Calculation
TH = WIP / CT
TH = Throughput [items/time unit]
WIP = Work-in-Process (average inventory) [items]
CT = Cycle Time (average time in system) [time units]
Lead Time Components
LT = PT + WT
LT = Lead Time (total time in system) [time units]
PT = Processing Time (value-added time) [time units]
WT = Wait Time (non-value-added time) [time units]
PT = 1 / TH
System Capacity & Utilization
Cmax = WIPmax / CTmin
Cmax = Maximum theoretical capacity [items/time unit]
WIPmax = Maximum allowable work-in-process [items]
CTmin = Minimum achievable cycle time [time units]
U = (THactual / THtheoretical) × 100%
U = System utilization [%]
Simple Example
You’ve got a packaging line. 20 boxes on the line (WIP). Each box on average takes 4 hours to move through (cycle time).
Throughput = WIP / CT = 20 / 4 = 5 boxes per hour.
If you drop WIP to 10 boxes but keep making boxes at 5 per hour, each box now spends only 2 hours in the process. That’s half the time, and you didn’t buy a single new machine.
Theory & Engineering Applications
Little's Law was proven in the early 1970s, but what matters for engineers is that it works in real systems—no need for fancy assumptions. If your average input rate matches your average output, and the system isn’t in startup or shutdown, you can use it. This rule applies whether your arrivals and service times are random, regular, or anything in between. As long as the process eventually clears out every item, it fits.
Mathematical Foundation and Proof Requirements
Little's Law comes down to this: L = λW, and you don't need to care about the detailed probability distributions in your factory or hospital to use it. It doesn't matter how many servers you have, if you use FIFO or random order, or what the service times look like. The one thing you need is a stable long-term system—input rate equals output rate, and you aren't counting transients during starts and stops. Make sure you observe over a representative period, so your averages mean something. If things can get stuck in the system forever, the results won't match reality.
Little's Law compares time-averaged numbers in the system to the average time spent by each item. It's important to match your measurement method to the setting: sample regularly over time for items in the system, not just counting arrivals and exits. In variable or cyclic systems, your measurement period must be long enough to even out noisy data.
WIP, Throughput, and Cycle Time Relationships
On a factory floor, Little's Law is the backbone for lean and Theory of Constraints approaches. WIP is every unfinished item between start and finish, including parts in process, queues, or waiting for a truck. If you want faster delivery, lower WIP without hurting throughput—cycle time drops, inventory drops, and cash moves faster. If you hold throughput steady and reduce WIP, you get shorter cycle times, period. But if you’re capacity constrained, you may need to keep extra WIP as a buffer; that’s the tradeoff. If your system is highly variable, the actual wait each item sees bounces around a lot, so while the average works out, individual experiences will be all over the map. If you care about those worst-case or best-case waits, you'll need more detailed queueing calculations than Little's Law can give.
Manufacturing and Production Line Applications
Take chip factories. Cycle time can run to weeks. If you track how much WIP is at each step, and the minimum time possible with no waiting, you can spot bottlenecks and wasted time. Same logic for an auto line—if the next station piles up WIP and you haven’t sped up the downstream process, you’ll see wait times blow out exactly as Little’s Law predicts. No reason not to work out the numbers before making changes or spending money—often you'll find that the problem is too much inventory, not too little capacity.
Production managers in automotive assembly, for instance, measure WIP and cycle time at each workstation. If one station builds up a queue but processes at the same average rate, that’s a sign of an imbalance or extra variability somewhere else. Tracking this lets you set your improvement priorities without guessing.
For other applications, there are more specific calculators for production planning, inventory, and system performance—these all lean on Little’s Law as a starting point.
Service Systems and Healthcare Applications
In emergency departments, managers use Little’s Law to check if numbers add up. Example: 120 patients/day, length of stay 4.2 hours—on average, about 21 patients in the department at one time. If you suddenly see higher or lower numbers, something in operations has changed. Same idea in call centers: 300 calls/hour, 6 minutes each on average—you’ll need about 30 agents for active calls (not counting waiting customers). If you’re trying to improve wait times or customer satisfaction, this is your simple reality check before digging deeper.
Software Development and Agile Methodology
For software teams, Little’s Law lets you put concrete numbers to how long work items hang around. If you finish 8 cards per week and have 24 active, average cycle time is 3 weeks per card. Without growing your delivery rate, the only way to move cards faster is to have fewer in progress. It also shows why multitasking slows everything down: spread yourself thin, and everything moves slower, no matter how efficient you feel.
If you want to cut cycle times, cut WIP. If you have to maintain current output but want things to move faster, don’t take on more at once than you can finish consistently. Kanban and Scrum teams use WIP limits for this reason, not for the sake of bureaucracy but to keep cycle times predictable.
Worked Example: PCB Assembly Line Optimization
Suppose you’ve got a board assembly (SMT) line. Key measurements:
- Average WIP: 187 boards on the line
- Average throughput: 23.4 boards/hour, measured over real shop shifts
- Theoretical minimum processing time: 4.2 minutes per board (if every station ran nonstop, no waiting)
- Shifts: 18 hours/day, 6 days/week
Step 1: Calculate Current Cycle Time
Little’s Law applied: CT = WIP / TH
CT = 187 ÷ 23.4 = ~8 hours per board
Step 2: Calculate Theoretical Minimum Cycle Time
The best possible CTmin = 4.2 min = 0.070 hours
This is with zero waiting anywhere.
Step 3: Calculate X-Factor
X-Factor = Actual CT / Theoretical CT = 7.991 ÷ 0.070 = 114.2
(Industry best practice gets the X-Factor down to the single digits; 114 means lots of non-value-added wait.)
Step 4: Break Down Wait vs. Processing Time
Processing time: PT = 1 / TH = 1 ÷ 23.4 = 0.0427 hours (2.56 min)
Wait time: WT = CT - PT = 7.991 - 0.0427 = 7.95 hours
So, 99.5% of board time is spent waiting. That’s where you’ll get the biggest gain.
Step 5: Capacity with Lower WIP
If you shrink WIP down to what’s actually needed and get waiting under control—say, CT = 0.5 hours:
WIP = TH × CT = 23.4 × 0.5 = 11.7 boards
Or, if you keep WIP but run closer to CTmin, then:
Maximum possible throughput: THmax = 187 ÷ 0.070 = 2,671 boards/hour (unrealistic in real shops, but that’s the mathematical maximum)
More realistically (taking X-Factor 5), TH = 187 ÷ (0.070 × 5) = 534 boards/hour
Current utilization: 23.4 ÷ 534 = 4.4%
Step 6: Recommendations
Target: Drop WIP to about 25 boards (almost 90% lower) but keep output at 23.4/hr
Target CT = 25 ÷ 23.4 ≈ 1.1 hours per board
That’s an 85% cut in cycle time, plus massive inventory savings.
You get there by finding and killing sources of delay—machine downtime, material shortages, big batch moves, or rework holding up flow. The percentages make it clear where to focus; Little’s Law quantifies the pain points directly.
Use this approach anywhere you find pile-ups—not just electronics but any repeating process. The effect on cash flow and customer delivery speed is immediate.
Practical Applications
Scenario: Manufacturing Operations Manager Reducing Lead Time
James runs a machine shop making aerospace parts. The shop’s seeing 6-week lead times, so contracts are at risk. Counting inventory, he sees 340 parts WIP and 81.5 parts/week out the door (throughput of about 11.6/day). His actual cycle time: 4.17 weeks. If he drops WIP to 245 (by better planning, not spending capital), holding throughput steady, his cycle time becomes exactly 3 weeks. This solves his customer issue using just improved process control and smaller transfer batches, no new equipment needed.
Scenario: Hospital Administrator Improving Emergency Department Flow
Dr. Chen is under pressure in a 450-bed hospital: 156 patients a day come through the ED, average 27 in the department at any time, so average stay is 4.15 hours. State rules say stay must be less than 4 hours to avoid fines. She uses the calculator to check: at 156/day, hitting 3.75 hours requires census down to 23.4 patients. She looks for quick-wins: a fast-track lane, speeding up labs, and bedside registration—all targeted to specific time chunks per patient. None of these ideas need new building space.
Scenario: Software Development Team Lead Implementing Kanban Limits
Marcus leads a dev team bogged down by multitasking and late projects. At the start, they have 34 stories in progress and finish 11.3 per week—so their cycle time is about 3 weeks. He uses the calculator to show that if he limits WIP to just 18 stories (2 per dev), with the same team capacity, average cycle drops to about 1.6 weeks. He makes the change, posts a visible WIP limit, and after a month measures a nearly identical improvement. Multitasking drops, stress comes down, and deadlines become more predictable—all for free.
Frequently Asked Questions
Free Engineering Calculators
Explore our complete library of free engineering and physics calculators.
Browse All Calculators →🔗 Explore More Free Engineering Calculators
About the Author
Robbie Dickson — Chief Engineer & Founder, FIRGELLI Automations
Robbie Dickson brings over two decades of engineering expertise to FIRGELLI Automations. With a distinguished career at Rolls-Royce, BMW, and Ford, he has deep expertise in mechanical systems, actuator technology, and precision engineering.
Need to implement these calculations?
Explore the precision-engineered motion control solutions used by top engineers.


