If you're working with maintenance histories and downtime logs, you'll probably want to know two things: how long can you expect the equipment to run before the next unplanned stoppage, and how long will it take to bring it back up if something goes wrong. The Reliability MTBF MTTR Calculator lets you crunch those numbers—mean time between failures, mean time to repair, system availability, failure rate, and the likelihood your machine lasts a whole shift or mission. These numbers aren't academic—they affect budgets in any operation where downtime burns real money, like factories, telecom networks, or power plants. Below, you'll get the practical formulas, a real-world example, and a breakdown of common reliability engineering ideas used on actual shop floors.
What is MTBF and MTTR?
MTBF (Mean Time Between Failures) tells you, on average, how many hours you get between system breakdowns. MTTR (Mean Time To Repair) tells you, on average, how many hours it takes to patch things up and get running again. These two numbers drive actual equipment uptime.
Simple Explanation
Think of MTBF as the number of miles between car breakdowns—the longer you go between tow trucks, the better the reliability. MTTR is the time it takes at the mechanic to get a fix in place. If breakdowns are rare and repairs are quick, you barely notice the downtime. That’s the practical picture of high availability.
📐 Browse all 1000+ Interactive Calculators
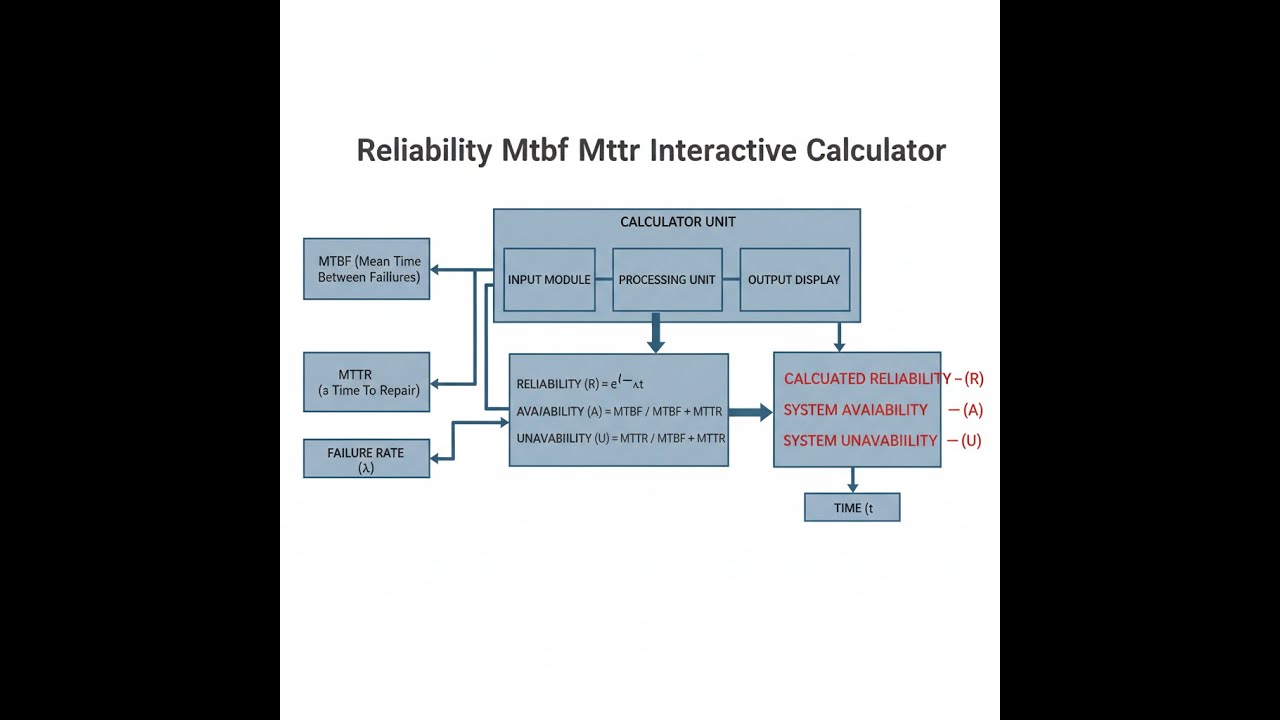
System Reliability Diagram

Reliability MTBF MTTR Calculator
How to Use This Calculator
This calculator is intended for education, concept evaluation, and preliminary design. Results are based on the equations and assumptions described on this page, but cannot account for every real-world load case, tolerance, material property, environmental condition, installation detail, safety factor, code, or regulatory requirement. Verify all inputs, assumptions, units, and results independently before selecting components or using the result in a real application. Safety-critical, structural, medical, lifting, transportation, or regulated applications must be reviewed by a qualified engineer.
- Pick your calculation mode (MTBF, MTTR, Availability, Failure Rate, Reliability at a certain time, or downtime/cost totals).
- Plug in your measured or estimated data—such as operating hours and failure count for MTBF.
- For modes that use them, adjust time period, hourly cost, or target mission time as needed.
- Hit Calculate to view the results.
Reliability MTBF MTTR Interactive Calculator
Use real-life data for operating hours and failures to immediately see what reliability, downtime, and repair rates actually look like. Adjust the inputs to check how each metric changes.
MTBF
1000 hrs
MTTR
3.0 hrs
AVAILABILITY
99.7%
FAILURE RATE
0.001/hr
FIRGELLI Automations — Interactive Engineering Calculators
Reliability Equations
Use the formula below to calculate Mean Time Between Failures.
Mean Time Between Failures (MTBF)
MTBF = Total Operating Time / Number of Failures
Where:
- MTBF = Mean Time Between Failures (hours)
- Total Operating Time = Cumulative operating hours (hours)
- Number of Failures = Count of system failures (dimensionless)
Use the formula below to calculate Mean Time To Repair.
Mean Time To Repair (MTTR)
MTTR = Total Repair Time / Number of Repairs
Where:
- MTTR = Mean Time To Repair (hours)
- Total Repair Time = Cumulative repair duration (hours)
- Number of Repairs = Count of repair actions (dimensionless)
Use the formula below to calculate System Availability.
System Availability
A = MTBF / (MTBF + MTTR)
Where:
- A = Availability (decimal or percentage)
- MTBF = Mean Time Between Failures (hours)
- MTTR = Mean Time To Repair (hours)
Use the formula below to calculate Failure Rate.
Failure Rate (λ)
λ = 1 / MTBF
Where:
- λ = Failure rate (failures per hour, or per 1000 hours, or per year)
- MTBF = Mean Time Between Failures (hours)
Use the formula below to calculate Reliability at a given time.
Reliability Function
R(t) = e-λt = e-t/MTBF
Where:
- R(t) = Reliability at time t (probability, 0 to 1)
- e = Euler's number (≈2.71828)
- λ = Failure rate (failures per hour)
- t = Mission time or operating duration (hours)
- MTBF = Mean Time Between Failures (hours)
Use the formula below to calculate Expected Number of Failures.
Expected Number of Failures
N = T / MTBF
Where:
- N = Expected number of failures (dimensionless)
- T = Analysis period or total operating time (hours)
- MTBF = Mean Time Between Failures (hours)
Simple Example
A pump operates for 5,000 hours and fails 5 times. Across all failures, it spends 10 hours getting fixed.
- MTBF = 5,000 / 5 = 1,000 hours
- MTTR = 10 / 5 = 2 hours
- Availability = 1,000 / (1,000 + 2) = 99.80%
- Failure Rate = 1 / 1,000 = 0.001 failures per hour
Theory & Engineering Applications
Reliability engineering lets you put real numbers on whether your system will work as planned for the time you actually need it. MTBF (Mean Time Between Failures) and MTTR (Mean Time To Repair) are the main yardsticks for process uptime, maintenance scheduling, and how you plan spares or backup units. MTBF tells you how long a system typically runs before it hits trouble; MTTR tells you how long it takes to get that system working again. These numbers aren't just theoretical—they’re how you plan maintenance intervals, parts inventory, and total cost of keeping systems running in any real operation.
Understanding MTBF and Its Limitations
MTBF is meant for systems that you fix after they break. Just divide the total run time by how many times it broke down in that period. If a line operates non-stop (8,760 hours per year) and sees 12 breakdowns, that line has an MTBF of 730 hours. The standard MTBF formula assumes that breakdowns don’t get more likely as time passes—this only holds in the “middle” of the equipment lifetime, not during initial start-up (higher failure rate at first) or when things are getting worn out. Don't mix up MTBF with Mean Time To Failure (MTTF)—MTTF is for parts you throw out (like bearings or light bulbs) instead of repair. When repair time is tiny compared to operating time, MTBF and MTTF end up similar, but most practical machinery uses MTBF, not MTTF, because failed equipment usually gets repaired and put back in service. For the number people, the failure rate λ is just 1 divided by the MTBF. This can be reported per hour, per thousand hours, or per year, depending on how your industry tracks it. Always double-check what unit's being quoted.
MTBF and MTTF are not interchangeable. Use MTTF for disposable parts, MTBF for repairable machines. If you’re looking at a component that only gets replaced, like an integrated circuit, use MTTF. If your operation involves repairs and the same unit going back into service, go with MTBF. Use the right one for your actual use case.
For reference, λ (failure rate) = 1/MTBF. So if MTBF is 730 hours, then λ = 0.00137 failures/hour. The reporting convention—failures per 1,000 hours, per year, per million hours (FIT), etc.—depends on the sector, so be careful with conversions.
MTTR and Maintainability Engineering
MTTR isn't just the hands-on wrench time. It also includes diagnosing the failure, waiting on paperwork, hunting down spares, completing the physical repair, and double-checking that everything works. In most plants, the “repair” itself is only a fraction of the total downtime; a big chunk is spent waiting on parts or approvals. Maintenance planning that only looks at raw “fix time” misses the elephant in the room. If you want real availability improvements, you’ll often get more benefit from streamlining how fast you detect problems, get parts, or start repairs than from cutting down on the physical repair itself.
There's more than one MTTR. Some people separate out Mean Time To Detect, Mean Time To Respond, and Mean Time To Restore. It’s worth tracking these—if you have a good idea where the bottleneck really is, you can focus attention on reducing the delays that matter. The simple formula averages everything, but examining a breakdown by failure types or delay steps will show you where to concentrate improvement.
Availability Analysis and System Design
System availability comes from the straightforward ratio A = MTBF / (MTBF + MTTR). For a production line with 730-hour MTBF and 4-hour MTTR, the calculator spits out 99.45% availability. But that still means 48 hours of downtime a year—a big deal if your plant loses tens of thousands every hour. When your business can't tolerate extended downtime, chasing “five nines” (99.999% availability) means either major increases to MTBF, drastic cuts to MTTR, or you need redundancy built in. Industries like telecom routinely use redundancy so equipment downtime doesn't stop everything. Remember: after a certain point, it's easier (and often cheaper) to cut MTTR than force up the MTBF. If you have an MTBF of 10,000 hours and an MTTR of 100 hours, doubling the MTBF improves availability less than halving the MTTR. This is why field replaceable units, fast diagnostics, and pre-staged spares are a big part of modern maintenance strategy.
Reliability Prediction and Mission Success
The function R(t) = e-t/MTBF gives you the chance a system will still be running, without failure, for a set mission duration. For instance, with an MTBF of 500 hours, the odds of surviving a 10-hour mission are about 98%. For longer or riskier missions, reliability drops—quickly. Systems like satellites get around this with redundancy, since you can’t roll a tech out for repairs. If you need reliability over longer windows (like weeks or years), expect to combine component-level improvements with smart system-level design (redundancy, parallel paths, etc.) so the overall system meets your reliability goal. Sliding mission length up directly cuts the reliability probability. Plan accordingly.
Fully Worked Engineering Example: Industrial Compressor Analysis
Let's say a plant runs an air compressor continuously for two years (17,520 hours). It’s tracked 27 failures, with 143.4 hours total time spent getting the compressor fixed. The site manager wants the hard numbers: expected downtime for next year and what it’ll cost if nothing is changed. Downtime costs $3,850 an hour due to halted batches, environmental risks, and wasted labor.
Step 1: Calculate Current MTBF
MTBF = 17,520 hours / 27 failures = 648.89 hours
Step 2: Calculate Current MTTR
MTTR = 143.4 hours / 27 repairs = 5.311 hours
Step 3: Calculate System Availability
A = 648.89 / (648.89 + 5.311) = 0.9919 (99.19%)
Step 4: Calculate Failure Rate
λ = 1 / 648.89 = 0.001541 failures/hr (or 1.541 failures per 1,000 hours, or about 13.5 failures per year at 8,760 hrs/year)
Step 5: Project Annual Performance
For the coming year (8,760 operating hours):
- Expected failures = 8,760 / 648.89 = 13.50 per year
- Total expected repair time = 13.50 × 5.311 = 71.70 hours
- Expected downtime cost = 71.70 × $3,850 = $276,045
- Net uptime = 8,760 - 71.70 = 8,688.3 hours (99.18% uptime)
Step 6: Evaluate Improvement Scenarios
Option A: Investing $45,000 in predictive maintenance could stretch MTBF to 950 hours (cutting failures to 9.22 per year):
- New failures = 8,760 / 950 = 9.22 per year
- Repair time = 9.22 × 5.311 = 48.97 hours
- Downtime cost = 48.97 × $3,850 = $188,535
- Savings = $276,045 - $188,535 = $87,510/year
- Payback = $45,000 / $87,510 = ~6.2 months
- New availability = 950 / (950 + 5.311) = 99.44%
Option B: Spending $68,000 per year to keep a tech and parts on site could cut MTTR to 2.0 hours (keeping current MTBF):
- Failures = 13.5 per year
- Repair time = 13.5 × 2.0 = 27.0 hours
- Downtime cost = 27.0 × $3,850 = $103,950
- Annual net benefit = $276,045 - $103,950 - $68,000 = $104,095
- Availability = 648.89 / (648.89 + 2.0) = 99.69%
Step 7: Calculate Mission Reliability
For a critical 72-hour batch: under baseline, R = e-72/648.89 = 0.8949. Under Option A (MTBF = 950), R = e-72/950 = 0.9270. So Option A slightly reduces the odds of losing a batch during that window. Pick your investment: sharper cost cut or better critical batch reliability.
Option B returns better annual benefit and higher uptime, but if critical batch completion without failure is the top goal (e.g., avoiding costly investigations or product recalls), bumping up MTBF may be worth it. Always check both annual bottom line and the odds of making it through your most sensitive processes.
Advanced Reliability Concepts
When you stack up system reliability, the weakest link matters—if you need every series component to work, overall reliability drops fast as parts are added. For example, five components at 98% each combine for only 90% total reliability. That's why simpler systems are usually more reliable. If you need to push reliability higher, add redundancy. Two separate parallel units, each 90% reliable, together give you 99% because either one working is enough. Going to three gives 99.99%—which is why things like aircraft flight controls use triple redundancy. Bathtub curves show that product life isn't just flat—the early phase sees higher failure rates (bad parts, build issues), the middle phase is stable (where MTBF applies), and the end phase sees wear-out. Don’t use MTBF alone in those early or late lifecycle periods—it's misleading. Use time-dependent models like Weibull distributions to capture what’s really happening for non-random failure modes such as wear and tear.
Practical Applications
Scenario: Data Center Infrastructure Planning
Marcus oversees a financial services data center. Downtime costs $125,000 per second. The cooling setup has a real-world MTBF of 8,200 hours and an MTTR of 6.5 hours (99.92% availability)—not enough for high-frequency trading clients who demand 99.999% uptime. Marcus checks the numbers: adding N+1 redundancy (with auto failover, slashing MTTR to 0.3 hours) or stretching MTBF to 15,000 hours with better maintenance. Redundancy pulls availability close to the five-nines mark; boosting MTBF alone doesn't get him there. With the calculator, he shows how the $850k investment in redundancy saves $18M per year in downtime. No marketing—just the numbers.
Scenario: Manufacturing Equipment Warranty Analysis
Jennifer, a reliability engineer at a robot manufacturer, plugs in field test data: 47 beta units, 127,000 hours, 23 failures, 89.3 hours repair time. She gets an MTBF of 5,522 hours and MTTR of 3.88 hours. That lets her predict 4.76 failures per cobot over three years (15,768 hours at three shifts per day), costing $5,902 per unit in warranty expenses. She models how pushing MTBF up to 8,000 hours or cutting MTTR to 2.0 hours drives warranty costs down—to $4,068 and $3,048 per unit, respectively. This lets her team pick the cost-effective reliability improvements for next model year—grounded in real field data.
Scenario: Fleet Maintenance Optimization for Telecommunications
David manages maintenance for 2,847 cell towers. With depot-based service, radios show MTBF of 22,300 hours and MTTR of 4.2 hours. Now, rural coverage increases travel to 9.8 hours for a fix, dropping availability from 99.98% to 99.96%. The effect: 3.5 more downtime hours per site, over 9,965 hours total, causing significant revenue and penalty losses each year. David uses the calculator to pit three approaches: stick with central repair, build regional hubs, or roll out predictive maintenance and pre-positioned spares to get MTTR down to 3.5 hours and MTBF up to 28,000 hours. Option 3 knocks downtime to 3,842 hours across the fleet and pays for itself within a year—showing reliability math can make maintenance a profit contributor.
Frequently Asked Questions
▶ What is the difference between MTBF and MTTF, and when should I use each metric?
▶ How much historical data do I need to calculate meaningful MTBF and MTTR values?
▶ Why doesn't doubling MTBF double system availability, and what improvement strategies are most effective?
▶ How do I account for different failure modes with different repair times when calculating overall MTTR?
▶ What are common mistakes when collecting data for MTBF and MTTR calculations?
▶ How do reliability predictions change over a product's lifecycle, and when is exponential distribution inappropriate?
Free Engineering Calculators
Explore our complete library of free engineering and physics calculators.
Browse All Calculators →🔗 Explore More Free Engineering Calculators
About the Author
Robbie Dickson — Chief Engineer & Founder, FIRGELLI Automations
Robbie Dickson brings over two decades of engineering expertise to FIRGELLI Automations. With a distinguished career at Rolls-Royce, BMW, and Ford, he has deep expertise in mechanical systems, actuator technology, and precision engineering.
Video Walkthrough - How to Use This Calculator
Need to implement these calculations?
Explore the precision-engineered motion control solutions used by top engineers.


