Buying a home locks you into regular monthly payments for a long time. Whether the loan fits your budget often depends on checking the numbers up front. This Mortgage Monthly Payment Calculator lets you work out your monthly payment (either just Principal & Interest or full PITI) using your actual loan amount, rate, term, and all the extras like property taxes, insurance, PMI, and HOA fees. Running these calculations matters—whether you’re buying your first house, checking cash flow on a rental, or considering a refinance. On this page: the complete amortization math, a worked example, how the payments are structured, and a FAQ focused on decisions that make a real difference.
What is a mortgage monthly payment?
This is the amount you pay each month to pay off your home loan. Most of it repays the original money you borrowed (principal), plus interest for using the bank’s money. Often, your monthly payment also bundles in property taxes, home insurance, and required fees.
Simple Explanation
In practice, a mortgage breaks a large sum into equal monthly payments—but the lender gets paid for this flexibility. The cost is interest, which hits hardest in the early years—initial payments go mostly to interest, not reducing your debt much. As time passes, more of your payment goes toward principal instead. That slow handoff from interest to principal is amortization.
📐 Browse all 1000+ Interactive Calculators
Payment Structure Diagram

Interactive Mortgage Calculator
How to Use This Calculator
This calculator is intended for education, concept evaluation, and preliminary design. Results are based on the equations and assumptions described on this page, but cannot account for every real-world load case, tolerance, material property, environmental condition, installation detail, safety factor, code, or regulatory requirement. Verify all inputs, assumptions, units, and results independently before selecting components or using the result in a real application. Safety-critical, structural, medical, lifting, transportation, or regulated applications must be reviewed by a qualified engineer.
- Pick what you want to figure—monthly payment, max loan, payoff time, interest rate, or a summary schedule.
- Fill in the loan amount, annual rate, and term. If you want to see the full monthly bill (PITI), add taxes, insurance, PMI, and HOA fees.
- For Afford or Payoff mode, enter your monthly payment budget or actual payment as prompted.
- Click Calculate to get your answers.
Mortgage Monthly Payment Interactive Visualizer
See in real time how your payment and total interest shift as you change loan balance, interest rate, or term. The chart makes it clear that payments start interest-heavy and tip toward principal as the years pass.
MONTHLY PAYMENT
$1,896
PRINCIPAL THIS MONTH
$271
INTEREST THIS MONTH
$1,625
FIRGELLI Automations — Interactive Engineering Calculators
Payment Formulas
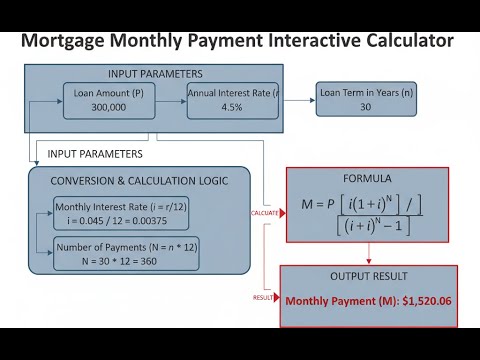
The formula below gives you your base monthly principal and interest payment.
Monthly Principal & Interest Payment
M = P × [r(1 + r)n] / [(1 + r)n - 1]
Where:
- M = Monthly principal and interest payment (dollars)
- P = Principal loan amount (dollars)
- r = Monthly interest rate (annual rate / 12 / 100)
- n = Total number of monthly payments (years × 12)
Total Monthly Payment (PITI)
PITI = M + T + I + PMI + HOA
Where:
- PITI = Total monthly payment including all costs (dollars)
- M = Principal and interest payment (dollars)
- T = Monthly property tax (annual tax / 12, dollars)
- I = Monthly homeowners insurance (annual premium / 12, dollars)
- PMI = Monthly private mortgage insurance (dollars)
- HOA = Monthly homeowners association fees (dollars)
Maximum Affordable Loan
Pmax = Mavailable × [(1 + r)n - 1] / [r(1 + r)n]
Where:
- Pmax = Maximum loan amount you can afford (dollars)
- Mavailable = Maximum monthly payment minus taxes, insurance, PMI, HOA (dollars)
- r = Monthly interest rate (dimensionless)
- n = Total number of payments (months)
Payoff Time with Extra Payments
nactual = -ln(1 - Pr/Mactual) / ln(1 + r)
Where:
- nactual = Actual number of payments to payoff (months)
- P = Principal loan amount (dollars)
- r = Monthly interest rate (dimensionless)
- Mactual = Actual monthly payment with extra amount (dollars)
- ln = Natural logarithm
Payment Breakdown at Month k
Ik = Bk-1 × r
Principalk = M - Ik
Bk = Bk-1 - Principalk
Where:
- Ik = Interest portion of payment k (dollars)
- Bk-1 = Outstanding balance before payment k (dollars)
- r = Monthly interest rate (dimensionless)
- Principalk = Principal portion of payment k (dollars)
- Bk = Outstanding balance after payment k (dollars)
Simple Example
Loan amount: $200,000 | Interest rate: 6% annually | Term: 30 years | No taxes, insurance, or PMI.
Monthly rate r = 6 / 100 / 12 = 0.005 | n = 360 payments
M = 200,000 × [0.005 × (1.005)³⁶⁰] / [(1.005)³⁶⁰ − 1]
M = 200,000 × [0.005 × 6.0226] / [6.0226 − 1] = 200,000 × 0.005996 = $1,199.10/month
Total interest over 30 years: $1,199.10 × 360 − $200,000 = $231,676
Theory & Engineering Applications
Mortgage payment calculations use standard compound interest ideas, reducing future costs to present value. In a fixed-rate mortgage, payments stay the same, but each month a bit more goes to principal and less to interest, so by the end the debt is paid off with nothing left owing.
Mathematical Foundation of Mortgage Amortization
The formula for monthly payment comes directly from the present value of an annuity. The total up-front loan is equal to the present value of the stream of all future monthly payments, each discounted by the periodic rate. This geometric sum, when solved for M, yields M = P × [r(1 + r)ⁿ] / [(1 + r)ⁿ - 1].
There’s a key practical point: monthly payment is more sensitive to interest rate than most people realize—especially for larger loans or long terms. For a $400,000 loan over 30 years, bumping the rate by 0.25% increases the monthly payment by about $58, and adds north of $21,000 in extra interest over the life of the loan. This is a compounding effect and the main reason small differences in rate matter so much.
Amortization Schedule Dynamics
At the start of the mortgage, most of the payment goes to interest because interest is figured on the full principal. As principal drops, so do interest charges each month. That leaves more and more of your fixed payment left over to pay down principal. For a typical 30-year, 6.75% loan, the first payment is roughly 83% interest, 17% principal. By the end, almost everything goes to principal. There’s a point, usually around year 17 on a 30-year loan at these rates, where the amount going to principal finally overtakes the interest portion. There’s nothing inherently special about that point mathematically, but it’s often a gut-check moment for borrowers. Lenders sometimes structure other products around these dynamics to tune for early or late payment impact.
PITI Components and Total Housing Cost
Your actual monthly housing outflow typically includes more than just principal and interest—there’s property tax, homeowner’s insurance, and if you put down less than 20%, PMI (private mortgage insurance). In many parts of the US, property taxes or insurance can make up a large chunk of your payment, and these factors vary widely by state. PMI will set you back roughly 0.5% to 1.5% per year of the original loan, which on a $350,000 loan means $146 to $438 extra monthly—money you stop paying once you reach 20% equity. Tracking when you hit that 20% is usually worth the effort, since PMI removal often saves more than a rate drop.
Interest Rate Impact and Present Value Sensitivity
For buyers stretching the budget, the interest rate typically affects affordability much more than home price. Going up 1% in mortgage rate is like raising the price of the home by 10% from the payment’s perspective. At $400k, a 6% mortgage costs $2,398 monthly; at 7%, $2,661 monthly—that’s the same payment as buying a $440,000 house at 6%. These numbers explain why the market can cool abruptly when rates go up, even if prices don’t change. Lender rates basically follow the 10-year Treasury yield plus a risk “spread,” which grows during economic upheaval and shrinks in stable times. That spread covers things like the risk the borrower defaults or pays off early.
Worked Example: Comprehensive Mortgage Analysis
Scenario: Buyer finances $340,000 (20% down on $425,000 home) at 6.75% for 30 years. Property tax $5,100/year, insurance $1,870/year, no PMI, no HOA fees.
Step 1: Calculate monthly principal and interest
P = $340,000
Monthly rate r = 0.005625
Term n = 360
(1 + r)ⁿ = 7.3847
M = 340,000 × [0.005625 × 7.3847] / [7.3847 - 1] = $2,211.70
Step 2: Calculate total monthly payment (PITI)
Property tax: $425/month
Insurance: $155.83/month
PMI/HOA: $0
Total = $2,211.70 + $425 + $155.83 = $2,792.53/month
Step 3: Calculate total cost over loan lifetime
P&I paid: $2,211.70 × 360 = $796,212
Interest portion: $796,212 - $340,000 = $456,212 (that’s 134% of what you borrowed)
Step 4: Analyze first payment breakdown
Balance: $340,000
Interest: $1,912.50
Principal: $299.20
New balance: $339,700.80
Nearly 87% of first payment is interest
Step 5: Analyze payment 180 (midpoint)
Balance: $282,137
Interest: $1,587.02
Principal: $624.68
At year 15, most of the payment still goes to interest (about 72%)
Step 6: Compare with extra payment scenario
Extra payment: $2,500 total/month
New payoff time: n = 258 months ≈ 21.5 years
Total paid: $645,250
Interest saved: $796,212 - $645,250 = $150,962 (and you finish 8.5 years earlier)
Applications in Real Estate Finance and Investment Analysis
Developers use these numbers to figure out the maximum project size based on debt service coverage. For commercial deals, the property’s net operating income often needs to be 25% to 35% larger than the debt payment. Say a property brings in $50,000 monthly NOI and needs a 1.3 coverage ratio—max monthly debt allowed is $38,462. At 7.25% over 25 years, that gives a total loan around $5.15M.
For rentals, cash-on-cash return is just annual cash flow divided by out-of-pocket equity. A $500,000 rental, 25% down ($125,000), $375,000 at 7%/30 years: $2,494.73 payment. Rent: $3,200, less $450 expenses and $208 tax, leaves just $47.27/month or $567/year—0.45% return before appreciation. This is common in tight markets—cash flow is almost zero, so the real upside is appreciation, not income. Always run the numbers before assuming a leveraged deal produces big returns.
For more related calculators (NPV, IRR, depreciation), check the FIRGELLI calculator hub.
Refinancing Decision Analysis
Refinancing only makes sense if total payment savings, discounted to present-day dollars, add up to more than the upfront costs. As an example: owe $300,000 at 7.5%, payment $2,097.52. Refinance to 6.25%, you get $1,847.66/month, and the refi costs $4,500. Simple payback is $4,500 / $249.86 ≈ 18 months. But a proper present value calculation discounts future savings at your own investment return rate; if your investments earn 10%, the value of shaving two-plus years off your loan may not outweigh redeploying your money elsewhere. Always work this out on paper, not just by looking at payment difference.
Practical Applications
Scenario: First-Time Homebuyer Budget Planning
Marcus, a 28-year-old software engineer making $95,000 a year in Austin, TX, is looking for his first house. He’s already paying $1,200/mo on student/car loans. His gross income is $7,917/mo, so his total debt cap is $3,404 using the standard 43% ratio. Subtract his existing debts—he has $2,204 left for a housing payment. Figure taxes at $458/mo, insurance at $175/mo, PMI at $180/mo (with 10% down), and Marcus has $1,391 to spend on principal and interest. At 6.875% and a 30-year loan, this means a max loan of $210,347. With $28,000 down, his actual buying power is $238,347. The calculator kept him from getting overextended by showing his true limit before looking at homes.
Scenario: Investment Property Cash Flow Analysis
Jennifer, who manages properties, considers a fourplex for $680,000 that earns $5,800 rent a month. Expenses are $14,500 per year. Planning to finance 80% ($544,000) at 7.25% for 30 years, she checks the calculator and finds her principal and interest will be $3,710.24/month. Add monthly operating costs of $1,208.33 and taxes of $765, and she's at $5,683.57/month versus $5,800 rent. This leaves only $116.43 in cash flow—under 1% cash-on-cash return on her $136,000 down. If she runs a 20-year payoff model, payments rise, cash flow drops, but she saves $317,533 in interest across the life of the loan and is debt-free years sooner. She chooses the fast payoff to focus on eliminating risk before retirement.
Scenario: Refinancing Decision for Rate Reduction
David and Sarah bought their house with a $425,000 mortgage at 7.125%. After three years, they owe $408,392 (27 years left), and their credit has improved enough to get 5.875% on the new loan. Their current payment is $2,859.47, and they get a refinance offer at $2,411.82/month plus $6,200 closing costs. They calculate the simple breakeven as 14 months. Looking deeper, they see their current interest portion is $2,425/month but would drop to $1,998/month after refinancing. The total interest over the remainder of the current loan is $520,775; after refinancing (plus fees), $387,630, saving $133,145 in the long run. The payment relief helps, but the bigger win is the huge cut in lifetime interest.
Frequently Asked Questions
What is the difference between principal and interest, and why does the ratio change over time? +
How much does making one extra payment per year actually save on a 30-year mortgage? +
Is it better to put 20% down to avoid PMI or put less down and invest the difference? +
Why do mortgage calculators sometimes show different results for the same inputs? +
How do property taxes and insurance affect what I can actually afford? +
Should I choose a 15-year or 30-year mortgage, and how do I decide? +
Free Engineering Calculators
Explore our complete library of free engineering and physics calculators.
Browse All Calculators →🔗 Explore More Free Engineering Calculators
About the Author
Robbie Dickson — Chief Engineer & Founder, FIRGELLI Automations
Robbie Dickson brings over two decades of engineering expertise to FIRGELLI Automations. With a distinguished career at Rolls-Royce, BMW, and Ford, he has deep expertise in mechanical systems, actuator technology, and precision engineering.
Video Walkthrough - How to Use This Calculator
Need to implement these calculations?
Explore the precision-engineered motion control solutions used by top engineers.


