If your manufacturing line runs all day and still can’t hit the numbers, OEE is a good place to start troubleshooting. This calculator gives you an honest look at how much of your scheduled time actually makes shippable product, using the basic inputs: availability, performance, and quality. OEE is useful anywhere uptime and output matter—automotive, pharma, food plants, job shops—any operation where the machines make or break your numbers. Below, you’ll find the OEE formula, step-by-step calculation, loss categories, typical usage, and some frequently asked questions.
What is Overall Equipment Effectiveness (OEE)?
OEE is a single percent value showing how much of your scheduled production time actually creates saleable parts. It’s just the product of three ratios: availability (actual running time vs. scheduled), performance (how fast you ran vs. "ideal"), and quality (good parts vs. total). If you have a weakness in any area, your OEE drops accordingly.
Simple Explanation
Treat OEE as a way to spot wasted time. Imagine a bucket filled with your scheduled hours. Every breakdown or adjustment drains it (availability loss). Running the machine under its rated speed is another leak (performance loss). Scrap or rework means you wasted part of what’s left (quality loss). OEE tells you what’s left in the bucket: a score of 85% means you get 85 good minutes out of every 100 scheduled, and you need to track down what happened to the rest.
📐 Browse all 1000+ Interactive Calculators
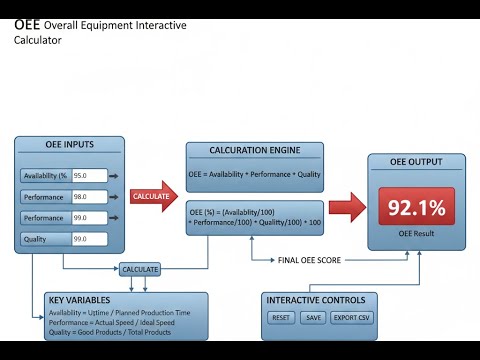
Visual Diagram

OEE Calculator
How to Use This Calculator
This calculator is intended for education, concept evaluation, and preliminary design. Results are based on the equations and assumptions described on this page, but cannot account for every real-world load case, tolerance, material property, environmental condition, installation detail, safety factor, code, or regulatory requirement. Verify all inputs, assumptions, units, and results independently before selecting components or using the result in a real application. Safety-critical, structural, medical, lifting, transportation, or regulated applications must be reviewed by a qualified engineer.
- Pick a calculation mode—full OEE, or break it down to individual factors like availability, performance, or quality.
- Key in your planned production time in minutes and any downtime (if you’re figuring out OEE or availability).
- Input ideal cycle time, plus part counts (produced, good, or both), as needed for your scenario.
- Hit Calculate. Your number will appear.
OEE Overall Equipment Effectiveness Interactive Calculator
Slide each lever and watch how the three OEE factors—availability, performance, quality—compound to shape your true productive output. Even minor slippage in just one area drags down the end result fast.
OVERALL OEE
70.1%
HIDDEN CAPACITY
42.7%
TOTAL LOSSES
29.9%
CLASS RATING
FAIR
FIRGELLI Automations — Interactive Engineering Calculators
Formulas & Equations
Simple Example
A machine runs a 480-minute shift, loses 60 minutes to downtime (run time = 420 min), produces 1,000 parts at a 24-second ideal cycle time, and 950 of those parts pass quality.
- Availability = 420 / 480 = 87.5%
- Performance = (1,000 × 24 / 60) / 420 = 400 / 420 = 95.2%
- Quality = 950 / 1,000 = 95.0%
- OEE = 0.875 × 0.952 × 0.950 = 79.2%
Use the formula below to calculate Overall Equipment Effectiveness.
Overall Equipment Effectiveness (OEE)
OEE = Availability × Performance × Quality
Use the formula below to calculate Availability.
Availability
Availability = (Run Time / Planned Production Time) × 100%
Run Time = Planned Production Time - Downtime
Where:
Planned Production Time = Total time equipment is scheduled to produce (minutes)
Downtime = All unplanned stops and breakdowns (minutes)
Run Time = Actual operating time (minutes)
Use the formula below to calculate Performance.
Performance
Performance = (Ideal Cycle Time × Total Count) / Run Time × 100%
Where:
Ideal Cycle Time = Fastest possible time to manufacture one part under optimal conditions (seconds per unit)
Total Count = Total parts produced including rejects (units)
Run Time = Actual operating time converted to seconds for calculation
Use the formula below to calculate Quality Rate.
Quality
Quality = (Good Count / Total Count) × 100%
Where:
Good Count = Parts meeting quality specifications (units)
Total Count = Total parts produced including rejects (units)
Use the formula below to calculate Required Production Time.
Required Production Time
Required Time = (Target Quantity × Ideal Cycle Time) / Target OEE
Where:
Target Quantity = Desired number of good parts (units)
Ideal Cycle Time = Time per unit at design speed (seconds or minutes)
Target OEE = Expected efficiency as decimal (0.85 for 85%)
Theory & Engineering Applications
The Six Big Losses Framework
OEE came out of Total Productive Maintenance, meant to put real numbers on how time is lost on the shop floor. Each OEE category maps to two out of the “Six Big Losses”: Availability hits unplanned and planned stops, Performance covers speed and minor, often undetected stops, and Quality rolls up your defects and startup scrap. Because you multiply these, a few small losses can quickly tank overall efficiency—a line running 90%, 90%, and 90% across the board only gets a 73% OEE.
The main value of OEE is that it shows how much “hidden capacity” you have before you look at buying more equipment. For example, running at 60% OEE means you could nearly double output if you close some obvious gaps. But OEE also has a practical limitation: you get more impact by fixing your weakest link than trying to perfect something that’s already strong. So, if you’re at 95% availability, 70% performance, and 98% quality, your best return is from making the process run faster—not sweating another percent of uptime.
Availability: The Foundation Metric
Availability is the share of scheduled time your machine is actually running. First, you exclude planned maintenance and breaks from the schedule—that’s your reference. The only downtime you count is the stuff you didn’t officially plan or announce well in advance. Breakdowns and changeovers are the usual drains: for example, ten 45-minute changeovers in a day can burn up most of a shift. The SMED approach tries to shrink changeover time, sometimes down to single digits for complex tools. The cost here is real—at high speeds, every minute of downtime is thousands in lost margin, often making changeover reduction more valuable than new equipment buys.
Performance: Speed Loss Quantification
Performance shows how fast you really run compared to design specs. Use the "ideal cycle time"—from vendor specs or your best time studies—not an average that already includes slowdowns. If you use a padded or outdated cycle time, you'll get misleadingly high performance numbers and miss where you’re losing speed. Small, frequent stops—say, under five minutes—often don’t show up in downtime logs but can quietly destroy your output rate. Automated tracking makes these losses visible. Fixing major breakdowns and steady microstoppages takes different approaches: focus your efforts based on what kind of issues are most common on your line.
Quality: First Pass Yield Integration
Quality asks what percent of finished parts meet spec straight off the line, no do-overs. Any part needing rework should count as bad initially—the value is gone, and you spend extra resources fixing it. Splitting between pure scrap and rework helps track where time and money go. Changeovers often spike scrap rates, especially for the first set of parts, so standardizing startup routines can save both material and overtime. Poor quality not only wastes scrap but also pushes operators to build more than needed, increasing both work-in-process and storage.
World-Class OEE Benchmarks by Industry
OEE norms are all over the map. Automated auto lines often see 85–90%. Pharma is usually lower because of inspection and cleaning complexity (around 70–75%). Food varies: steady-flow dairy may hit 90%, multi-product batch cookers often struggle to reach 60%. Modern chip fabs hit mid-80%s if fully automated, manual-heavy lines much less. The setup, automation, and level of batching drive this; chasing the “world-class” number makes sense only if you make comparable products on lines of similar complexity. Track your own OEE progress annually and compare only to your real direct peers.
Fully Worked Numerical Example
Scenario: You run a metal press for an eight-hour shift (480 minutes). Two breakdowns add up to 37 minutes. Four changeovers total 68 minutes downtime. Cycle time for the current part is 8.2 seconds. You get 2,847 parts out, and 2,691 pass inspection. What’s your OEE? Where’s the main loss?
Given Information:
- Planned Production Time = 480 minutes
- Breakdown Downtime = 37 minutes
- Changeover Time = 68 minutes
- Total Downtime = 37 + 68 = 105 minutes
- Ideal Cycle Time = 8.2 seconds per piece
- Total Parts Produced = 2,847 pieces
- Good Parts = 2,691 pieces
Step 1: Calculate Run Time
Run Time = Planned Production Time - Total Downtime
Run Time = 480 minutes - 105 minutes = 375 minutes
Step 2: Calculate Availability
Availability = (Run Time / Planned Production Time) × 100%
Availability = (375 / 480) × 100% = 78.125%
Step 3: Calculate Performance
First, convert run time to seconds: 375 minutes × 60 = 22,500 seconds
Ideal Production Time = Total Parts × Ideal Cycle Time
Ideal Production Time = 2,847 parts × 8.2 seconds/part = 23,345.4 seconds
Performance = (Ideal Production Time / Run Time) × 100%
Performance = (23,345.4 / 22,500) × 100% = 103.76%
Performance Validation: Getting over 100% means either your "ideal" cycle time number is off, or your process is unexpectedly fast (maybe the spec is outdated). In this case, cap performance at 100%, and put checking the true cycle time on your to-do list. This happens a lot—use data, not guesses, for "ideal" settings.
Step 4: Calculate Quality
Quality = (Good Parts / Total Parts) × 100%
Quality = (2,691 / 2,847) × 100% = 94.522%
Step 5: Calculate Overall OEE
OEE = Availability × Performance × Quality
With capped performance: OEE = 0.78125 × 1.00 × 0.94522
OEE = 0.7385 = 73.85%
Step 6: Identify Loss Analysis
Availability Loss = 100% - 78.125% = 21.875%
Performance Loss = 100% - 100% = 0% (after capping; actual value means double-check your cycle)
Quality Loss = 100% - 94.522% = 5.478%
Conclusion: The press’s OEE is 73.85%, which is about average for a mixed-batch plant. Most of the loss is in downtime—over 20% of your shift lost, mostly to changeovers. Cutting changeovers or attacking breakdowns is your clear path to improvement. Performance “over 100%” tells you your real cycle is better than documented; update or validate it with stopwatches. Scrap is typical, but if the losses are all startups, standardizing changeover setups can help. Focus your time where the biggest gaps are—the data points you to the right problem.
For more specialized engineering calculations, visit our comprehensive engineering calculator library.
Practical Applications
Scenario: Justifying Automation Investment
Marcus, a plant engineer, needs a solid case for spending $2.3M on an automated inspection cell to replace manual checks on transmission parts. His manual process runs 68% OEE—88% available (breaks and shift handoff eat time), 82% performance (inconsistent inspector pace), 94% quality (some mistakes). He plugs projected automation numbers into the calculator and gets 92.6% OEE, which is a 36% jump in usable capacity. Multiplying this by daily volume and part margin, he maps out a one-year payback. The production time calculator confirms he’d meet higher-volume customer contracts with no extra shifts—using current OEE, he can’t get there even with overtime. The calculator translates process improvement into dollar impact for his project pitch.
Scenario: Diagnosing Performance Loss on Packaging Line
Jennifer sees OEE falling on her bottling line. No obvious breakdowns reported. Plugging numbers into the tool, she spots flat availability (85%) and better quality (now 96%), but OEE plummets. At a glance, performance on the shift report also looks unchanged, but digging further—using real cycle counts and actual time—she finds the ideal cycle time setting was quietly shifted in the line software: from 1.8 to 2.1 seconds/bottle. Using the actual original number, performance is way down—root cause traced to worn timing belts, causing mini-slowdowns but not official downtime. Data dies in spreadsheets, but OEE logic here drew her quickly to the source instead of chasing phantoms. Fixing the real issue kept the line running and dodged a major breakdown expense.
Scenario: Production Planning for New Product Launch
Aisha is planning the ramp for a consumer electronics launch—250,000 units in 12 weeks. Her injection molding line makes the housings; cycle time is 23 seconds, and past OEE is 76%. OEE calculator says she’ll need 1,208 hours. She’s only got 960 shift-hours scheduled. Before scheduling overtime, she models: can she squeeze to 85% OEE, or cut just a couple seconds per cycle with tool tweaks? Both bridge the gap without extra labor. The tool changes the discussion from a rush-labor panic to what to fix for real throughput gains—with numbers, not impressions.
Frequently Asked Questions
What is a "good" OEE score and how does it vary by industry? +
Should planned maintenance be included in OEE calculations? +
How do I determine the correct ideal cycle time for my equipment? +
Can OEE be calculated for manual assembly operations? +
What data collection frequency is needed for accurate OEE tracking? +
How does OEE relate to Overall Labor Effectiveness (OLE)? +
Free Engineering Calculators
Explore our complete library of free engineering and physics calculators.
Browse All Calculators →🔗 Explore More Free Engineering Calculators
About the Author
Robbie Dickson — Chief Engineer & Founder, FIRGELLI Automations
Robbie Dickson brings over two decades of engineering expertise to FIRGELLI Automations. With a distinguished career at Rolls-Royce, BMW, and Ford, he has deep expertise in mechanical systems, actuator technology, and precision engineering.
Video Walkthrough - How to Use This Calculator
Need to implement these calculations?
Explore the precision-engineered motion control solutions used by top engineers.


