Choosing the wrong LED for a project — or retrofitting without the numbers — costs real money in wasted energy and over-specified hardware. Luminous efficacy (lm/W) is the single most important metric for comparing LED performance and justifying upgrade decisions. Use this LED Luminous Efficacy Calculator to calculate efficacy, luminous flux, electrical power, energy savings, wall-plug efficiency, and required luminaire counts using luminous flux, wattage, voltage, current, and reference lamp data. It's directly applicable to commercial retrofit analysis, industrial lighting design, and LED product development. This page covers the core formulas, a worked example, engineering theory, and an FAQ.
What is LED Luminous Efficacy?
LED luminous efficacy is a measure of how efficiently an LED converts electrical power into visible light. It's expressed in lumens per watt (lm/W) — the higher the number, the more light you get for every watt consumed.
Simple Explanation
Think of it like fuel economy for a light source. A car that gets 50 miles per gallon is more efficient than one getting 20 mpg — same idea here, just swapping miles for lumens and gallons for watts. An LED rated at 150 lm/W is simply producing more usable light per unit of energy than one rated at 80 lm/W, so you spend less on electricity for the same brightness.
📐 Browse all 1000+ Interactive Calculators
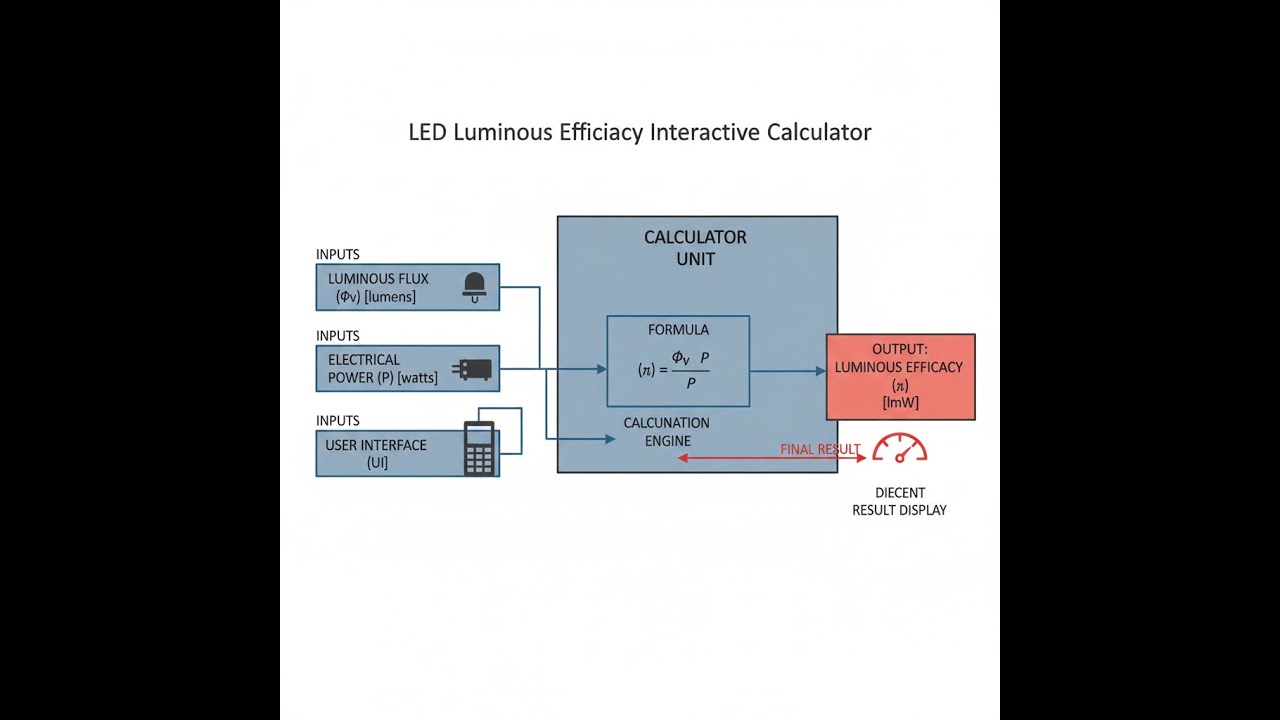
LED Efficacy Diagram

LED Luminous Efficacy Interactive Calculator
How to Use This Calculator
- Select a calculation mode from the dropdown — choose from efficacy, luminous flux, electrical power, energy savings, wall-plug efficiency, or required luminaires.
- Enter the required input values that appear for your selected mode — these may include luminous flux (lumens), electrical power (watts), forward voltage (V), forward current (A), reference efficacy, operating hours, electricity cost, or target lumens.
- Check your units before calculating — lumens for light output, watts for power, volts and amps for electrical inputs.
- Click Calculate to see your result.
Simple Example
An LED produces 800 lumens and consumes 10 watts of electrical power. Enter 800 in the Luminous Flux field and 10 in the Electrical Power field with the mode set to Calculate Luminous Efficacy. The result: 80 lm/W — rated Moderate Efficiency. Annual energy at 3,000 hours of operation: 30 kWh.
LED Luminous Efficacy Interactive Visualizer
See how voltage, current, and light output determine LED efficiency in real-time. Drag sliders to visualize the relationship between electrical power input and luminous flux output.
ELECTRICAL POWER
3.2 W
EFFICACY
150 lm/W
WALL-PLUG EFF.
22.0%
RATING
HIGH
FIRGELLI Automations — Interactive Engineering Calculators
Equations & Formulas
Luminous Efficacy
Use the formula below to calculate luminous efficacy.
η = Φv / Pe
Where:
- η = Luminous efficacy (lm/W)
- Φv = Luminous flux (lumens)
- Pe = Electrical power input (watts)
Electrical Power
Use the formula below to calculate electrical power from forward voltage and current.
Pe = Vf × If
Where:
- Pe = Electrical power (watts)
- Vf = Forward voltage (volts)
- If = Forward current (amperes)
Wall-Plug Efficiency
Use the formula below to calculate wall-plug efficiency as a percentage of the theoretical maximum.
WPE = (η / 683) × 100%
Where:
- WPE = Wall-plug efficiency (%)
- η = Luminous efficacy (lm/W)
- 683 = Maximum theoretical efficacy at 555 nm (lm/W)
Energy Savings
Use the formula below to calculate energy savings when replacing a reference lamp with an LED.
Esaved = (Pref - PLED) × t × 10-3
Where:
- Esaved = Energy savings (kWh)
- Pref = Reference lamp power (watts)
- PLED = LED lamp power (watts)
- t = Operating time (hours)
Required Luminaires
Use the formula below to calculate the number of luminaires needed to meet a target light output.
N = ⌈Φtarget / Φper unit⌉
Where:
- N = Number of luminaires (rounded up)
- Φtarget = Target total luminous flux (lumens)
- Φper unit = Luminous flux per luminaire (lumens)
- ⌈ ⌉ = Ceiling function (round up to nearest integer)
Theory & Engineering Applications
Luminous efficacy represents the fundamental performance metric for any light source, quantifying how effectively electrical energy is converted into visible light perceivable by the human eye. Unlike radiant efficiency, which measures total electromagnetic radiation output, luminous efficacy is weighted by the photopic luminosity function that peaks at 555 nanometers (green light) where human vision is most sensitive. This distinction is critical because an LED might produce substantial infrared or ultraviolet radiation that contributes nothing to perceived brightness yet consumes electrical power, reducing luminous efficacy.
Simple Example
An LED chip operates at 3.2 V forward voltage and 1.0 A forward current. Electrical power = 3.2 × 1.0 = 3.2 W. Measured luminous output = 480 lumens. Efficacy = 480 ÷ 3.2 = 150 lm/W — rated High Efficiency. Wall-plug efficiency = (150 ÷ 683) × 100 = 22.0%.
Fundamental Physics of LED Light Generation
Light-emitting diodes generate photons through electroluminescence in a semiconductor p-n junction. When forward-biased, electrons from the n-type region recombine with holes from the p-type region, releasing energy approximately equal to the bandgap energy (Eg = hc/λ). For a blue LED with emission at 450 nm, the theoretical minimum forward voltage is approximately 2.76 V. However, real devices require higher voltages (typically 3.0-3.4 V for commercial blue LEDs) due to contact resistance, series resistance in the semiconductor layers, and non-radiative recombination processes.
The theoretical maximum luminous efficacy of 683 lm/W applies only to monochromatic light at 555 nm. All other wavelengths have lower theoretical maxima due to the photopic response curve. A red LED at 650 nm can theoretically achieve only 73 lm/W, while a blue LED at 450 nm is limited to approximately 92 lm/W. White LEDs, which combine multiple wavelengths, face additional constraints. Phosphor-converted white LEDs (the most common type) typically use a blue LED chip to excite yellow phosphors, with Stokes losses in the phosphor conversion process reducing overall efficacy by 15-30% compared to the blue pump LED alone.
Temperature Dependence and Thermal Management
A frequently overlooked aspect of LED efficacy is its strong temperature dependence. As junction temperature increases, several degradation mechanisms activate. Carrier overflow becomes more pronounced at elevated temperatures, where increased thermal energy allows charge carriers to escape the active region before recombining radiatively. Auger recombination, a non-radiative process where the energy from electron-hole recombination is transferred to a third carrier rather than emitted as a photon, increases exponentially with temperature and carrier density.
Practical measurements show that luminous efficacy typically decreases by 0.3-0.6% per degree Celsius above 25°C for high-power LEDs. A 10-watt LED operating with a junction temperature of 85°C (60°C above room temperature) might experience an 18-36% reduction in efficacy compared to operation at 25°C. This temperature dependence creates a critical design challenge: higher drive currents increase light output but also increase junction temperature, which reduces efficacy and can negate the benefits of increased current. Optimal thermal design involves heatsinking to maintain junction temperatures below 70-80°C for premium performance.
Current Density Effects and Efficiency Droop
LED efficacy is not constant with drive current—a phenomenon termed "efficiency droop" that has puzzled researchers for decades. At low current densities (below 10 A/cm²), efficacy increases approximately linearly with current as the active region becomes more uniformly populated with carriers. However, as current density increases beyond 10-50 A/cm², efficacy peaks and then decreases substantially, even as total light output continues to increase.
Multiple physical mechanisms contribute to droop. Auger recombination scales with the cube of carrier density, becoming dominant at high injection levels. Carrier delocalization effects in the quantum wells, junction heating from series resistance, and current crowding near the electrical contacts all contribute. For InGaN-based blue LEDs, the peak efficacy typically occurs at current densities of 10-35 A/cm². Operating at twice this current density might reduce efficacy by 25-40%, meaning that driving an LED at maximum rated current often sacrifices significant efficiency for increased absolute light output.
Worked Engineering Example: Industrial Lighting Retrofit Analysis
Consider a manufacturing facility replacing 87 metal halide high-bay fixtures. Each existing 400-watt metal halide fixture (including ballast losses) consumes 458 watts and produces approximately 36,000 lumens when new, giving an initial system efficacy of 78.6 lm/W. Due to lumen depreciation, after 8,000 hours of operation, output has decreased to approximately 30,600 lumens (85% maintenance), reducing effective efficacy to 66.8 lm/W.
Proposed LED replacement specifications:
- Luminous output: 32,000 lumens per fixture
- Electrical power: 224 watts per fixture
- Initial efficacy: 32,000 / 224 = 142.9 lm/W
- Predicted L70 lifetime: 60,000 hours (time to 70% lumen maintenance)
Energy calculations:
The facility operates 5,840 hours annually (16 hours/day, 365 days/year). Current annual energy consumption: 87 fixtures × 458 W × 5,840 hours = 232,557 kWh. Proposed LED consumption: 87 fixtures × 224 W × 5,840 hours = 113,676 kWh. Annual energy savings: 232,557 - 113,676 = 118,881 kWh (51.1% reduction).
At an industrial electricity rate of $0.087/kWh, annual cost savings equal $10,343. Additional savings accrue from reduced maintenance: metal halide lamps require replacement every 15,000-20,000 hours (approximately annually at this duty cycle) at $37 per lamp plus $43 labor per fixture, totaling approximately $6,960 annually for 87 fixtures. LED fixtures require no lamp replacements for approximately 10.3 years (60,000 hours ÷ 5,840 hours/year).
Power quality considerations:
The metal halide system operates at a power factor of approximately 0.92 with magnetic ballasts, drawing 458 W at 277 V = 1.65 A per fixture, but apparent power of 498 VA. The LED drivers operate at power factor 0.95, drawing 224 W at 236 VA per fixture. Total facility apparent power decreases from 43,326 VA to 20,532 VA, reducing demand charges and transformer loading.
Thermal impact:
Heat rejection to the space decreases by 118,881 kWh annually. In cooling season, this reduction decreases HVAC load. Assuming a 4-month cooling season, coefficient of performance (COP) of 3.2 for the facility's cooling system, and that 70% of lighting heat contributes to cooling load, the reduction in cooling energy equals: (118,881 kWh × 0.333 × 0.70) / 3.2 = 8,672 kWh annually, worth an additional $754 at the same electricity rate.
Total first-year savings: $10,343 (direct lighting energy) + $6,960 (avoided maintenance) + $754 (reduced cooling) = $18,057. With LED system installed cost of $67,400 ($775 per fixture including labor), simple payback is 3.73 years, well within typical industrial project criteria.
Spectral Power Distribution and Color Quality Trade-offs
Engineers frequently face trade-offs between luminous efficacy and color rendering quality. High color rendering index (CRI ≥ 90) LEDs typically achieve 15-25% lower efficacy than standard CRI 80 products because broad-spectrum phosphor systems necessary for high CRI convert more blue pump light to longer wavelengths with associated Stokes losses. Additionally, achieving saturated red rendering (R9 values above 50) requires red phosphors or direct red LED chips that contribute disproportionately little to luminous flux due to the eye's reduced sensitivity at 630-660 nm.
For applications where color discrimination is critical—surgical lighting, art galleries, textile inspection, food retail—the reduced efficacy of high-CRI products is an acceptable trade-off. However, in applications prioritizing energy efficiency over color quality—street lighting, warehouse illumination, parking structures—narrower-spectrum products optimized for efficacy are appropriate. The most efficient commercial white LEDs (CRI 70-75, CCT 5000-6500K) currently achieve 180-200 lm/W in laboratory conditions, while high-CRI warm white products (CRI ≥ 95, CCT 2700-3000K) typically achieve 90-120 lm/W.
Driver Efficiency Integration
Published LED chip efficacy values represent performance at the semiconductor junction, not including driver losses. Practical LED systems require AC-DC power conversion and current regulation, which introduce 8-20% additional losses depending on driver quality and loading. A high-quality driver operating at 92% efficiency transforms a 150 lm/W LED chip into a 138 lm/W system at the AC input. Budget drivers with 85% efficiency reduce this to 127.5 lm/W.
Driver efficiency varies with loading. Most LED drivers achieve peak efficiency at 70-90% of rated output and experience reduced efficiency at very light loads (below 30%) and at maximum rated output. Dimming further complicates the efficiency equation: phase-cut dimmers can reduce driver efficiency substantially, while dedicated 0-10V or DALI dimming systems maintain better efficiency across the dimming range. For critical energy efficiency applications, system-level measurements including driver losses provide more accurate performance predictions than LED chip specifications alone.
Practical Applications
Scenario: Commercial Building Energy Audit
Marcus, an energy consultant evaluating a 145,000 square-foot office complex, needs to compare the current fluorescent T8 lighting system against LED replacement options. The existing system uses 1,247 four-lamp fixtures, each consuming 128 watts (including ballast) and producing 11,200 lumens, giving an efficacy of 87.5 lm/W. He uses the calculator's energy savings mode, inputting the 11,200 lumens target, current 87.5 lm/W efficacy, and proposed LED efficacy of 142 lm/W from the replacement specification sheets. With 3,850 annual operating hours and electricity cost of $0.114/kWh, the calculator reveals annual savings of $61,847 per year. This quantitative analysis, combined with the calculated 2.8-year simple payback, gives Marcus the data needed to recommend the retrofit to building management with confidence in the financial return.
Scenario: LED Product Development Testing
Jennifer, a lighting engineer at an LED module manufacturer, is characterizing a new high-power chip operating at 3.17 volts forward voltage and 2.85 amperes forward current. Using an integrating sphere, she measures luminous output of 1,247 lumens. She uses the calculator's wall-plug efficiency mode, entering these values to determine that the electrical power consumption is 9.03 watts, giving an efficacy of 138.1 lm/W and a wall-plug efficiency of 20.2%. This efficiency value is critical for the product datasheet and helps her identify that the chip is performing within the expected range for this generation of phosphor-converted white LEDs. When she tests another chip from the same batch at elevated junction temperature (85°C instead of 25°C), the efficacy drops to 121.3 lm/W, confirming the expected thermal derating and validating the thermal management requirements specified in the product documentation.
Scenario: Agricultural Greenhouse Lighting Design
Robert, designing a supplemental lighting system for a 12,000 square-foot tomato greenhouse, needs to deliver 180,000 lumens total to achieve target photosynthetic photon flux density during low-light winter months. He's comparing two LED luminaire options: Option A provides 6,200 lumens per fixture at 47 watts (131.9 lm/W), while Option B provides 8,900 lumens per fixture at 71 watts (125.4 lm/W). Using the calculator's luminaire quantity mode, he determines Option A requires 30 fixtures consuming 1,410 watts total, while Option B requires 21 fixtures consuming 1,491 watts total. Despite Option A having higher per-unit efficacy, Option B's higher lumen output per fixture results in fewer fixtures needed, simplifying installation despite slightly higher energy consumption. The calculator helps Robert balance installation costs, energy costs, and mounting complexity, ultimately recommending Option B because the $830 installation savings from nine fewer fixtures offsets the $34 annual increase in electricity costs over the 10-year project lifecycle.
Frequently Asked Questions
▼ What luminous efficacy should I expect from modern LED products?
▼ Why does LED efficacy decrease with increased drive current?
▼ How does color temperature affect LED luminous efficacy?
▼ What is wall-plug efficiency and how does it relate to luminous efficacy?
▼ How should I account for LED efficacy degradation over time?
▼ What role does thermal management play in maintaining LED efficacy?
Free Engineering Calculators
Explore our complete library of free engineering and physics calculators.
Browse All Calculators →🔗 Explore More Free Engineering Calculators
About the Author
Robbie Dickson — Chief Engineer & Founder, FIRGELLI Automations
Robbie Dickson brings over two decades of engineering expertise to FIRGELLI Automations. With a distinguished career at Rolls-Royce, BMW, and Ford, he has deep expertise in mechanical systems, actuator technology, and precision engineering.
Need to implement these calculations?
Explore the precision-engineered motion control solutions used by top engineers.


