If you run out of stock during production or your busy season, it costs real money—and usually, it can be avoided if you set your inventory triggers based on something more concrete than gut feel. This calculator helps you figure out the number where you need to reorder, using your average demand, lead time, and a buffer (safety stock) based on practical numbers. In any operation—shop floor, retail warehouse, pharmacy—a missed reorder means downtime or missed sales. Below you'll find the formulas, examples, an explanation of the safety stock logic, and a FAQ that addresses the usual snags and edge cases.
What is a Reorder Point?
A reorder point is just the inventory threshold that tells you when to pull the trigger on your next order. Once you hit this level, you need to reorder so that your new supply arrives before you deplete what’s left.
Simple Explanation
This is a lot like your car’s low-fuel warning—it comes on long before you actually run out. Same idea here: your reorder point tells you it’s time to order more, while you've still got enough on the shelf to cover you until stock arrives. Anything over that minimum is your safety stock, meant to handle hiccups if sales pick up or if shipments slip.
📐 Browse all 1000+ Interactive Calculators
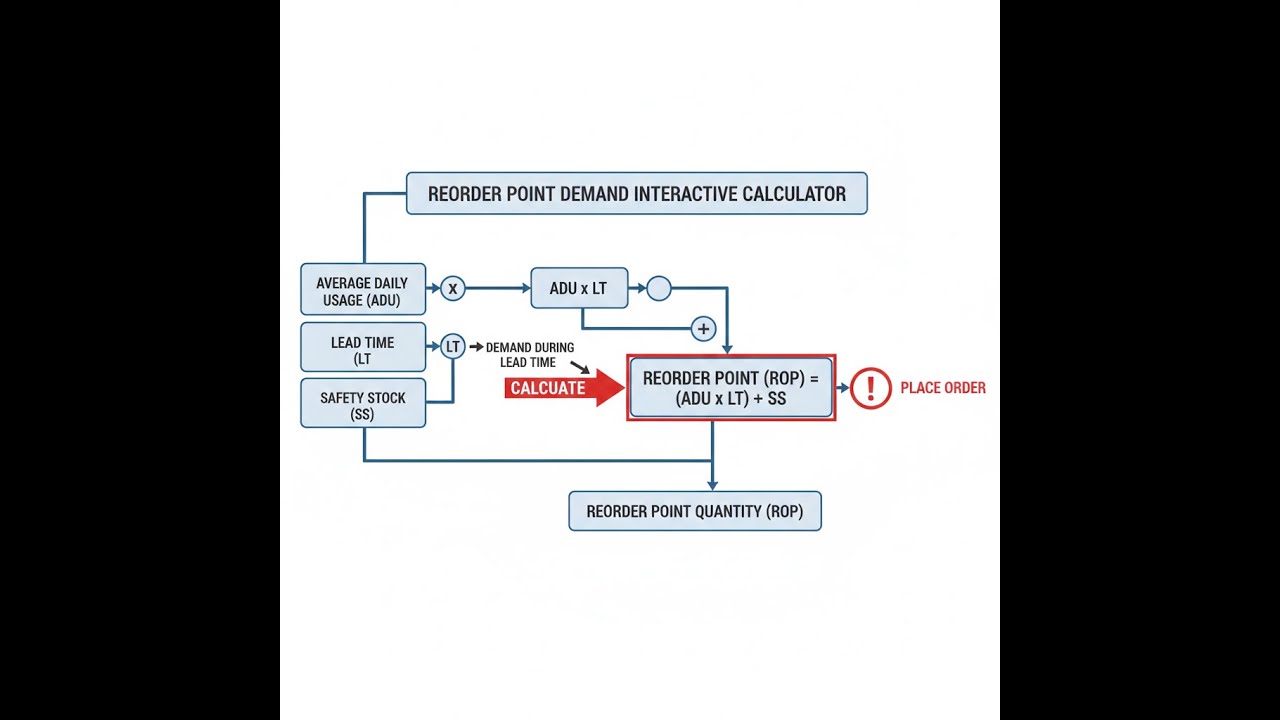
Visual Diagram

Reorder Point Demand Interactive Calculator
How to Use This Calculator
This calculator is intended for education, concept evaluation, and preliminary design. Results are based on the equations and assumptions described on this page, but cannot account for every real-world load case, tolerance, material property, environmental condition, installation detail, safety factor, code, or regulatory requirement. Verify all inputs, assumptions, units, and results independently before selecting components or using the result in a real application. Safety-critical, structural, medical, lifting, transportation, or regulated applications must be reviewed by a qualified engineer.
- Choose what you want to solve—Reorder Point, Average Daily Demand, Lead Time, Safety Stock, Maximum Daily Demand, or Z-Score.
- Enter your numbers (Average Daily Demand in units per day, Lead Time in days, and Safety Stock in units, or for the stats method, Demand Std Dev and Z-Score).
- Hit Calculate.
Reorder Point Demand Interactive Visualizer
This tool helps you see how changing demand, lead time, or safety stock shifts your reorder point and your risk of running out. Slide values to get a quick sense of how inventory coverage adjusts if, for example, deliveries are delayed or sales suddenly spike.
REORDER POINT
550 units
LEAD TIME DEMAND
500 units
DAYS COVERAGE
5.5 days
FIRGELLI Automations — Interactive Engineering Calculators
Formulas & Equations
Here are the standard reorder point formulas you'll actually use on real projects.
Basic Reorder Point Formula
ROP = (D × L) + SS
ROP = Reorder Point (units)
D = Average Daily Demand (units/day)
L = Lead Time (days)
SS = Safety Stock (units)
Maximum Demand Method
ROP = (Dmax × Lmax)
SS = (Dmax × Lmax) - (Davg × Lavg)
Dmax = Maximum Daily Demand (units/day)
Lmax = Maximum Lead Time (days)
Davg = Average Daily Demand (units/day)
Lavg = Average Lead Time (days)
Service Level Method (Statistical)
SS = Z × σD × √L
ROP = (D × L) + (Z × σD × √L)
Z = Service Level Z-Score (dimensionless)
σD = Standard Deviation of Daily Demand (units/day)
√L = Square Root of Lead Time (days0.5)
Common Z-Scores:
Z = 1.28 → 90% service level
Z = 1.65 → 95% service level
Z = 2.33 → 99% service level
Days of Coverage
Days = ROP ÷ D
Days = Days of Inventory Coverage (days)
ROP = Reorder Point (units)
D = Average Daily Demand (units/day)
Simple Example
Average daily demand: 100 units/day. Lead time: 5 days. Safety stock: 50 units.
Lead time demand = 100 × 5 = 500 units. Reorder point = 500 + 50 = 550 units. Place a new order when stock drops to 550 units.
Theory & Engineering Applications
The reorder point is the line where you act to restock. This is about keeping operations running—not some statistical exercise. If you dip below the reorder point in manufacturing, the next weak link in your supply chain stops the line. In practice, most shops and warehouses use a simple rule, but the theory comes from operations research aiming to balance risk and working capital.
Fundamental Theory of Reorder Point Optimization
The core reorder point formula ROP = (D × L) + SS is about two things: what you expect to use while waiting for more to arrive (D × L), plus an allowance (safety stock) to cover the unexpected. Lead time demand covers the basics—you just multiply how much you go through in a day by how long you have to wait for replenishment. Safety stock is there for anything out of the ordinary: late trucks, random demand spikes, or disruptions.
One thing that’s easy to overlook: most reorder point formulas assume you know your exact stock level at all times (continuous review). If you’re only checking once a week or month (periodic review), you need to add that review period to your effective lead time. Skipping this step will guarantee “surprise” shortages, especially in manual or low-tech setups.
Safety stock isn’t a fudge factor; it’s a calculation based on how much demand fluctuates. If you choose a high service level (big Z value), your inventory goes up fast, but it means fewer embarrassing “sorry, we’re out” moments or assembly stops. At some point, the extra inventory just sits, tying up cash with little added benefit to service. Finding that line is what engineers and managers argue about most.
Demand Variability and Lead Time Uncertainty
Standard reorder point formulas assume your demand looks like a bell curve (normal distribution). In real life, that’s rarely true. If your business sees lumpy, seasonal, or highly erratic demand, using those formulas gives you off-target numbers. In those cases, you’re better off using actual historical demand patterns or simulation, instead of just plugging numbers into normal distribution equations and hoping they apply.
If your lead times aren’t steady, things get trickier. Both variable demand and variable lead time need to be considered. When lead times bounce around, that uncertainty multiplies with your normal usage. The formula with both standard deviations shows how variability in supply is often a much bigger risk for fast-moving parts than some random order from a big customer.
Manufacturing and Production Applications
In manufacturing, reorder points don’t always play well with minimum order sizes set by suppliers. If the minimum order is more than what your formula spits out, you have to round up—and hold more inventory. For lines with many components, you’ll need to set ROP for each item to avoid missing a single bolt or chip and stopping the entire operation. Sometimes, physical systems like kanban cards solve the visibility problem better than just running calculations. These simple tools make sure everyone on the line knows when to order, which cuts down on surprises that can slip past a spreadsheet.
Multi-Echelon Inventory Considerations
If you have a supply chain with multiple steps—like a central warehouse feeding stores—reorder points aren’t independent. The upstream location needs to base its ROP on the sum of real usage plus all variability from the branches it serves. Usually, as you pool demand from more locations, the swings die down a bit (risk pooling), so the main warehouse doesn’t have to hold as much buffer per item as each branch would on its own.
In fields like pharma, the price of missing a reorder can be high—patients waiting for meds, or expensive materials going off before you use them. Sometimes, companies here use two reorder points: the usual one for routine restock, and a much lower emergency trigger for rush orders when something really critical is about to run out.
Economic and Financial Implications
Reorder points aren’t just for supply chain people—they affect cash flow. The average amount of inventory tied up is (Q/2) + SS, where Q is your order size. Safety stock is cash sitting on the shelf. If you let ROP drift high, a significant chunk of working capital is wasted. Before you bump up service levels, check how much extra safety stock (and money) you’re actually locking up—going from 95% to 99% can mean buying 40% more insurance for just a tiny bump in uptime. The smart move is to reserve high service levels for crucial parts, not every bin in the warehouse.
Worked Example: Electronic Component Distribution
Take a microcontroller distributor dealing with numbers like:
- Average daily demand: 847 units/day
- Standard deviation of daily demand: 126 units/day
- Average supplier lead time: 18 days
- Standard deviation of lead time: 3.2 days
- Target service level: 97.5% (Z = 1.96)
- Current inventory policy: Weekly review cycle
Step 1: Calculate Lead Time Demand
Lead time demand = D × L = 847 units/day × 18 days = 15,246 units
Step 2: Calculate Safety Stock with Demand and Lead Time Variability
Using the combined variability formula:
SS = Z × √(L × σD² + D² × σL²)
SS = 1.96 × √(18 × 126² + 847² × 3.2²)
SS = 1.96 × √(285,768 + 7,349,644)
SS = 1.96 × √7,635,412
SS = 1.96 × 2,763.4 = 5,416 units
Step 3: Account for Review Period
Since inventory is checked weekly (7 days), not continuously:
Effective lead time = L + R = 18 + 7 = 25 days
Revised lead time demand = 847 × 25 = 21,175 units
Revised safety stock with review period:
SS = 1.96 × √(25 × 126² + 847² × 3.2²)
SS = 1.96 × √(396,900 + 7,349,644)
SS = 1.96 × √7,746,544
SS = 1.96 × 2,783.3 = 5,455 units
Step 4: Calculate Reorder Point
ROP = Lead Time Demand + Safety Stock
ROP = 21,175 + 5,455 = 26,630 units
Step 5: Analyze Results
Days of coverage = 26,630 ÷ 847 = 31.4 days
Safety stock percentage = (5,455 ÷ 26,630) × 100 = 20.5%
The review cycle adds only 39 extra units of safety stock compared to continuous review, but big swings in supplier lead time add far more to the risk buffer than day-to-day order surprises. Shaving lead time variability (working with your supplier or switching vendors) often drops inventory much faster than improving your forecast. At scale, the savings in carrying costs add up quickly across a catalog—well beyond what you’d recoup with perfect demand predictions.
If this distributor managed to cut lead time variation from 3.2 to 2.0 days, the safety stock drops by 703 units, and at $3.78 per unit and 24% annual carry cost, that’s $637 a year saved per part. Multiply by a full product line, and you’re looking at real budget impact—demonstrating why process improvements in supply reliability beat chasing marginal forecasting gains.
If you need specific inventory calculations for other industries, check the main calculator page for tools covering everything from raw material planning to finished goods optimization.
Practical Applications
Scenario: Medical Device Manufacturing
In a pacemaker factory, Jennifer needs to keep the right number of titanium housings on hand. These come from Switzerland in 14 days, and usage averages 127 per day (fluctuates ±18). If she runs out, production stops with real consequences. Using the calculator and a service level of 99% (Z = 2.33), she gets ROP = (127 × 14) + (2.33 × 18 × √14) = 1,778 + 157 = 1,935 units. She reorders at 1,935. That safety stock, about 9% above standard use, is there for spikes and the occasional late shipment. The calculation fits the stakes—better to hold a few extra days’ worth than risk assembly lines down or regulatory trouble.
Scenario: Retail Chain Distribution Planning
Marcus is in charge of inventory at a grocery DC. He normally ships out 2,340 packs a day, gets stock in 6 days, but has seen delays up to 9 days and sale spikes up to 3,100 packs per day. Using the max demand/lead time approach, the calculator shows he needs to cover the gap between worst-case (27,900) and typical demand during normal lead time (14,040): 13,860 units as safety stock. It's a big buffer, but it backs up store shelf commitments when a promotion happens to land during a supplier hiccup—not all that rare in this sector.
Scenario: Aerospace Fastener Supply
Robert manages a bin of titanium bolts used on aircraft. Each costs $47, average daily use is 83 with low variation, and supplier lead time is a steady 22 days. The plant’s standard policy targets 95% service level, and Robert’s bin carries 2,400 units. Using the calculator, with 83 per day and 22 days’ lead, that’s 1,826 units for lead time, leaving 574 in safety stock. Statistically, he only needs about 300 for 95% coverage (using a daily standard deviation of 12). That means the current setup ties up $12,878 too much—cash that could be put to use elsewhere. Adjusting the reorder point to 2,126 would do the job with less money locked in inventory.
Frequently Asked Questions
▶ What's the difference between reorder point and reorder quantity?
▶ How do I determine the right service level percentage for my products?
▶ Should I use average lead time or maximum lead time for reorder point calculations?
▶ How often should I recalculate reorder points?
▶ What should I do if my calculated reorder point is higher than my maximum inventory capacity?
▶ How do promotions and seasonal demand affect reorder point calculations?
Free Engineering Calculators
Explore our complete library of free engineering and physics calculators.
Browse All Calculators →🔗 Explore More Free Engineering Calculators
About the Author
Robbie Dickson — Chief Engineer & Founder, FIRGELLI Automations
Robbie Dickson brings over two decades of engineering expertise to FIRGELLI Automations. With a distinguished career at Rolls-Royce, BMW, and Ford, he has deep expertise in mechanical systems, actuator technology, and precision engineering.
Video Walkthrough - How to Use This Calculator
Need to implement these calculations?
Explore the precision-engineered motion control solutions used by top engineers.


