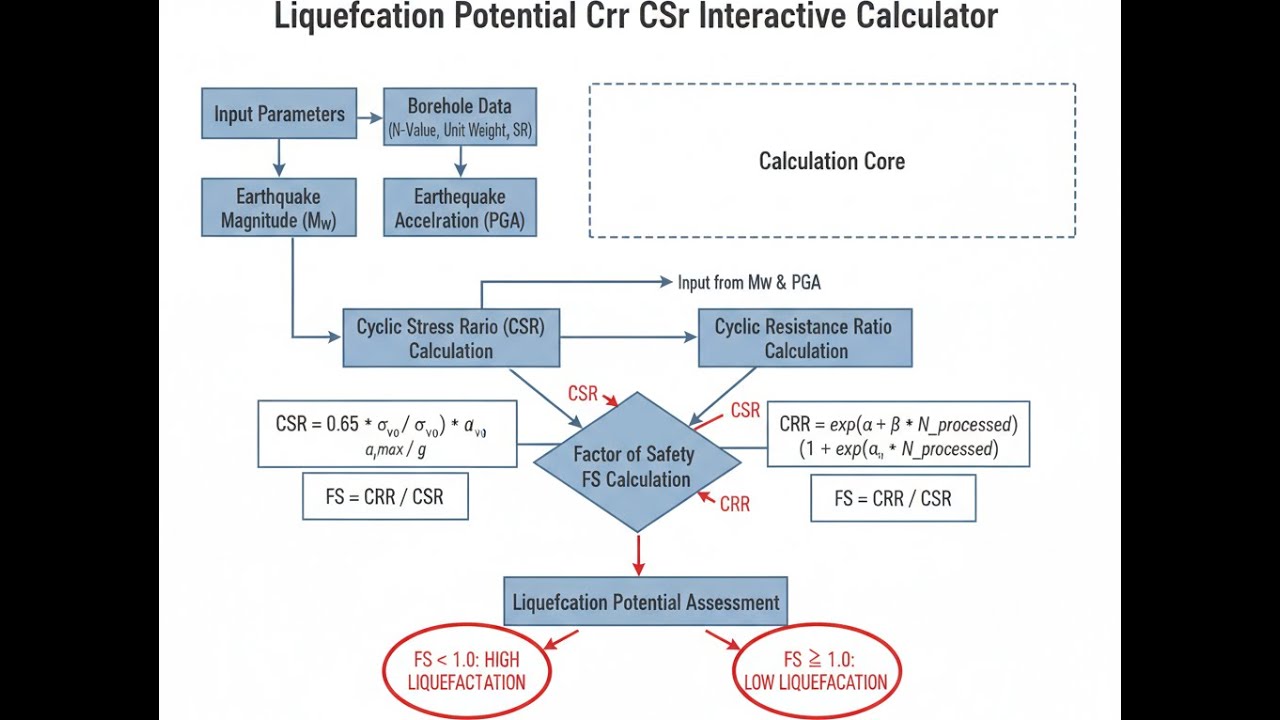
Saturated sandy soils under seismic loading can lose shear strength almost instantly — buildings sink, foundations fail, and buried pipelines float to the surface. Use this Liquefaction Potential Calculator to calculate the Factor of Safety against liquefaction using CRR (Cyclic Resistance Ratio), CSR (Cyclic Stress Ratio), SPT N-values, earthquake magnitude, and site-specific stress conditions. It matters across foundation design, bridge abutment assessment, and port infrastructure evaluation in seismic zones. This page includes the full Seed-Idriss simplified procedure, a worked example, variable definitions, and an FAQ.
What is Liquefaction Potential?
Liquefaction potential tells you how close saturated sandy soil is to behaving like a liquid under an earthquake. To estimate risk, engineers weigh the soil’s resistance to earthquake shaking (CRR) against the predicted stress from the earthquake (CSR).
Simple Explanation
If you shake a jar of wet sugar, it goes from holding its shape to flowing like syrup. Saturated sand works the same way: undisturbed, it holds up structures just fine. Shake it hard and fast enough, pore water pressure increases because water can’t escape fast enough, and the grains lose contact with each other. At that instant, the ground won’t support anything above it.
📐 Browse all 1000+ Interactive Calculators
Diagram

How to Use This Calculator
- Select your Calculation Mode from the dropdown — Factor of Safety, CSR, CRR, rd, MSF, or N160cs.
- Enter the required input values that appear for your selected mode (e.g., CRR and CSR for Factor of Safety mode, or depth for rd mode).
- Use the "Try Example" button to load pre-filled sample values if you want to see how the calculator works before entering your own data.
- Click Calculate to see your result.
Liquefaction Potential Calculator
This calculator is intended for education, concept evaluation, and preliminary design. Results are based on the equations and assumptions described on this page, but cannot account for every real-world load case, tolerance, material property, environmental condition, installation detail, safety factor, code, or regulatory requirement. Verify all inputs, assumptions, units, and results independently before selecting components or using the result in a real application. Safety-critical, structural, medical, lifting, transportation, or regulated applications must be reviewed by a qualified engineer.
Liquefaction Potential Interactive Visualizer
Watch how saturated sand transforms from solid to liquid-like behavior during earthquake shaking. Adjust soil properties and seismic conditions to see how CRR and CSR determine the Factor of Safety against liquefaction.
FACTOR OF SAFETY
1.25
SPT N-VALUE
15
LIQUEF. RISK
MODERATE
FIRGELLI Automations — Interactive Engineering Calculators
Equations & Variables
Use the formula below to calculate the Factor of Safety against liquefaction.
Factor of Safety Against Liquefaction
FS = CRR / CSR
FS = Factor of safety (dimensionless)
CRR = Cyclic resistance ratio (dimensionless)
CSR = Cyclic stress ratio (dimensionless)
Use the formula below to calculate the Cyclic Stress Ratio.
Cyclic Stress Ratio
CSR = 0.65 × (amax/g) × (σv/σ'v) × rd
amax = Peak ground acceleration (m/s² or expressed as g)
g = Gravitational acceleration (9.81 m/s²)
σv = Total vertical stress (kPa)
σ'v = Effective vertical stress (kPa)
rd = Stress reduction factor (dimensionless)
Use the formula below to calculate the Cyclic Resistance Ratio using the simplified procedure.
Cyclic Resistance Ratio (Simplified Procedure)
CRR7.5 = (1/(34-N160cs)) + (N160cs/135) + (50/(10×N160cs+45)—) - (1/200)
CRR = CRR7.5 × MSF × Kσ
N160cs = Corrected SPT N-value for clean sand equivalent (blows/0.3m)
MSF = Magnitude scaling factor (dimensionless)
Kσ = Overburden correction factor (dimensionless)
Use the formula below to calculate the Stress Reduction Factor.
Stress Reduction Factor
For z ≤ 9.15 m: rd = 1.0 - 0.00765z
For 9.15 m < z ≤ 23 m: rd = 1.174 - 0.0267z
z = Depth below ground surface (m)
Use the formula below to calculate the Magnitude Scaling Factor.
Magnitude Scaling Factor
MSF = 102.24 / Mw2.56 (Idriss, 1999)
Mw = Moment magnitude of earthquake (dimensionless)
Use the formula below to calculate the fines content correction for SPT N-values.
Fines Content Correction for SPT
N160cs = α + β × N160
For FC ≤ 5%: α = 0, β = 1.0
For 5% < FC ≤ 35%: α = exp(1.76 - 190/FC²), β = 0.99 + FC1.5/1000
For FC > 35%: α = 5.0, β = 1.2
FC = Fines content (% passing No. 200 sieve)
N160 = Energy-corrected SPT N-value (blows/0.3m)
Simple Example
Mode: Factor of Safety
Inputs: CRR = 0.185, CSR = 0.142
FS = CRR / CSR = 0.185 / 0.142 = 1.303
Result: FS = 1.303 — No liquefaction expected (FS ≥ 1.3).
Theory & Engineering Applications
Fundamental Mechanism of Liquefaction
If you take a saturated sandy layer, earthquake shaking tries to compact the grains. If water can't escape fast enough, pressure rises and the grains actually lose contact — the soil “melts” temporarily. The simplified procedure by Seed and Idriss (1971) has become standard for checking this risk using field and lab data. It’s not a perfect test—it doesn’t cover every case, but it’s typically the baseline unless the ground conditions are very different.
When you check factor of safety (CRR/CSR), you’re getting a boundary—not a yes/no threshold. Sites right at FS=1.0 often do liquefy, but not always. In practice, FS ≥ 1.3 is set for important work, but if you push FS higher, you pay more and sometimes don’t actually avoid all damage. It’s a judgment call based on site details and how sure you are about your input data.
Cyclic Stress Ratio Calculation and Physical Significance
CSR basically compares the average earthquake-induced shear stress to effective stress in the ground. The factor 0.65 scales the peak to an average over many cycles—this lets you simplify a tricky real earthquake load down to a manageable calculation. The rd factor knocks down the stress ratio as you go deeper; real ground isn’t rigid and energy gets lost with depth and flexibility. Don’t expect surface shaking to directly translate to the base of your soil column.
Design codes assume level ground for this method. If the ground isn’t flat or you’ve got heavy fills, significant static shear changes things. When static shear gets above about 0.35× the effective stress, flow failures can happen at loads lower than predicted here. If you’re on a slope or working near a big fill, you’ll need more detailed analysis—or at least, dial your expectations back for the simplified approach.
Cyclic Resistance from Standard Penetration Test Data
CRR is tied to how stiff your soil is, often measured by Standard Penetration Test (SPT) N-values (corrected to 60% hammer energy and 100 kPa overburden). The link between N160cs and CRR7.5 is data-driven: old earthquake case histories, stacking sites that did and didn’t liquefy, and drawing a line separating the two. It’s not a theory — it’s pattern-matching from real failures and survivors.
When fines are present, that N-value means something different. In silty sand, you need to pack grains tighter for the same blow count, so at the same N, the sand is denser and more resistant to liquefaction. Corrections exist for non-plastic fines only. If fines content gets high enough, or if the fines are plastic (clayey), the whole simplified approach breaks down; the soil stops acting like sand and starts acting like clay.
Magnitude Scaling and Duration Effects
The Seed-Idriss baseline assumes a magnitude 7.5 earthquake—about 15 stress cycles. Fewer cycles (smaller earthquakes) mean soils can resist more, so you bump the CRR up with the MSF for lower magnitudes, and knock it down for higher. Idriss’s 1999 MSF equation is the usual tool for this. For Mw = 6.0 you get MSF ≈ 1.8; for Mw = 8.5 it drops to about 0.7.
Choosing the right design magnitude is a thorny issue. The biggest local event isn’t always the highest risk—sometimes a big distant earthquake triggers liquefaction deeper, not shallow. Both deterministic and probabilistic analyses are used; sometimes the single-magnitude approach misses a deeper hazard. Always check if hazard is coming from just one scenario, or if you need to run a few cases.
Fully Worked Example: Commercial Building Site Assessment
Let’s take a direct example—a three-story building in Oakland (CA) over saturated sand at 6 m depth. SPT N60 = 15, fines = 12%, unit weight = 19.2 kN/m³, water table at 3 m. Design earthquake Mw = 7.1, amax = 0.35g.
Step 1: Calculate vertical stresses
Total vertical stress: σv = 19.2 × 6.0 = 115.2 kPa
Pore water pressure: u = 9.81 × (6.0-3.0) = 29.43 kPa
Effective vertical stress: σ'v = 115.2 - 29.43 = 85.77 kPa
Step 2: Calculate stress reduction factor
z = 6 m: rd = 1.0 - 0.00765×6 = 0.9541
Step 3: Calculate cyclic stress ratio
CSR = 0.65 × (0.35) × (115.2/85.77) × 0.9541 = 0.2772
Step 4: Calculate overburden correction factor
σ'v = 85.77 kPa < 100, so Kσ = (85.77/100)-0.5 = 1.0798
Step 5: Correct SPT N for fines
For FC = 12% (between 5% and 35%):
α = exp(1.76 - 190/12²) = exp(0.441) = 1.554
β = 0.99 + (121.5/1000) = 1.032
N160cs = 1.554 + 1.032×15 = 17.03
Step 6: Get CRR at M = 7.5
CRR7.5 = (1/16.97) + (17.03/135) + (50/(215.3²)) - (1/200)
CRR7.5 = 0.0589 + 0.1261 + 0.001078 – 0.005 = 0.1811
Step 7: Magnitude scaling factor
MSF = 102.24 / 7.12.56 ≈ 1.126
Step 8: Final CRR and FS
CRR = 0.1811 × 1.126 × 1.0798 = 0.2203
FS = 0.2203 / 0.2772 = 0.795
Engineering Assessment: FS is well below 1.0—so liquefaction is expected here during the design earthquake. Options: bypass the layer (deep foundation) or improve the ground itself. The input data isn’t making this a borderline case—uncertainty analysis won’t flip the conclusion. For layers with better N-values or lower CSR, the answer could get closer to FS = 1.0, but here it’s clear.
Applications Across Engineering Disciplines
Liquefaction isn’t only a foundation issue. Bridge abutments, embankments, and port structures all run into trouble if the layer beneath them liquefies. Kobe 1995 showed how easily bridges can collapse when piers lose support. Ports often sit on reclaimed loose sand, which is the worst case—liquefaction can push wharves out meters toward the water.
Buried utilities have their own headaches. Liquefied soil loses all grip, so pipes can float up or get torn by settlement. Christchurch 2011 is a modern example where more was spent fixing pipes and mains than fixing buildings. City-scale mapping and risk scoring for liquefaction is now pretty standard for urban planning, especially anywhere near rivers, deltas, or reclaimed land.
For additional engineering calculations and design tools, explore the comprehensive calculator library covering structural, mechanical, and geotechnical applications.
Practical Applications
Scenario: Residential Foundation Design in Seismic Zone
A geotechnical engineer assessing a new subdivision near Seattle finds N-values from 8 to 18 in saturated sandy silt to 12 m depth. Using this calculator, CSR values for the design earthquake (Mw = 6.8, amax = 0.28g) yield FS between 0.6 and 1.1. This points to a need for ground improvement at shallow depths, with deeper sand layers usable for deep foundations. These calculations help the developer weigh the costs of site-wide soil densification against using piles that reach below the problem zone. The factor of safety numbers go straight into the budget and engineering tradeoffs.
Scenario: Emergency Response Planning for Critical Infrastructure
A civil engineer with a water district in Southern California runs the calculator for a 48-inch pipeline across an alluvial valley, plugging in the new higher PGAs (0.42g to 0.55g) and old boring logs. Several spots return FS below 0.8—meaning liquefaction and possible pipeline floatation/failure are likely in a major earthquake. This targeted analysis supports spending on ground improvement at risky crossings and the installation of flexible joints—converting a general hazard into a specific and justifiable mitigation plan.
Scenario: Forensic Investigation After Earthquake
After a M6.4 event in New Zealand, a forensic consultant checks damage at an apartment with tilted foundations. Inputting measured ground motion (amax = 0.38g), pre-earthquake N-values (average 11 blows/ft), fines content (8%), and the actual earthquake magnitude into this calculator, the FS comes out around 0.71 at 4-6 m depth. This documents liquefaction wasn’t only likely, but was the expected result for those specific ground conditions and shaking. The calculation helps with insurance and can trigger updates to local hazard maps.
Frequently Asked Questions
What factor of safety against liquefaction is considered acceptable for building foundations? +
Can liquefaction occur in gravelly soils or clay soils? +
How does groundwater depth affect liquefaction potential? +
What is the difference between liquefaction triggering and liquefaction consequence? +
Why is the SPT N-value corrected for fines content when assessing liquefaction? +
How does earthquake magnitude affect liquefaction potential through the MSF factor? +
Free Engineering Calculators
Explore our complete library of free engineering and physics calculators.
Browse All Calculators →🔗 Explore More Free Engineering Calculators
About the Author
Robbie Dickson — Chief Engineer & Founder, FIRGELLI Automations
Robbie Dickson brings over two decades of engineering expertise to FIRGELLI Automations. With a distinguished career at Rolls-Royce, BMW, and Ford, he has deep expertise in mechanical systems, actuator technology, and precision engineering.
Need to implement these calculations?
Explore the precision-engineered motion control solutions used by top engineers.


