Predicting how a glowing object's color shifts with temperature is a core problem in lighting design, pyrometry, and astrophysics — and getting it wrong means mismatched light sources, calibration drift, or blown sensor specs. Use this Color Temperature Blackbody Calculator to calculate peak wavelength, spectral radiance, total radiant exitance, and CIE chromaticity coordinates using temperature or peak wavelength as inputs. It matters across lighting engineering, infrared thermography, semiconductor process control, and astronomical imaging. This page includes the governing formulas (Planck's Law, Wien's Displacement Law, Stefan-Boltzmann Law), a worked example at 3200K, full theory, and an FAQ.
What is color temperature blackbody radiation?
Color temperature describes how the color of light emitted by a glowing object changes as it gets hotter. A blackbody is an idealized object that absorbs all incoming radiation and emits light purely based on its temperature — no reflections, no selective absorption.
Simple Explanation
Think of heating a metal rod: first it glows dull red, then orange, then yellow-white as it gets hotter. That color shift follows predictable physics. A blackbody is just the ideal version of that rod — it tells you exactly what color and how much light any object would emit if it were a perfect thermal radiator at a given temperature.
📐 Browse all 1000+ Interactive Calculators
Visual Diagram

Color Temperature Blackbody Calculator
How to Use This Calculator
- Select a Calculation Mode from the dropdown — choose Full Spectrum Analysis, Peak Wavelength, Total Radiant Exitance, Spectral Radiance, CIE Chromaticity, or Color Rendering Index.
- Enter the required input value — either a temperature in Kelvin, a peak wavelength in nanometers, or both (for Spectral Radiance mode).
- Use the Try Example button to load a pre-set input if you want to see a typical result first.
- Click Calculate to see your result.
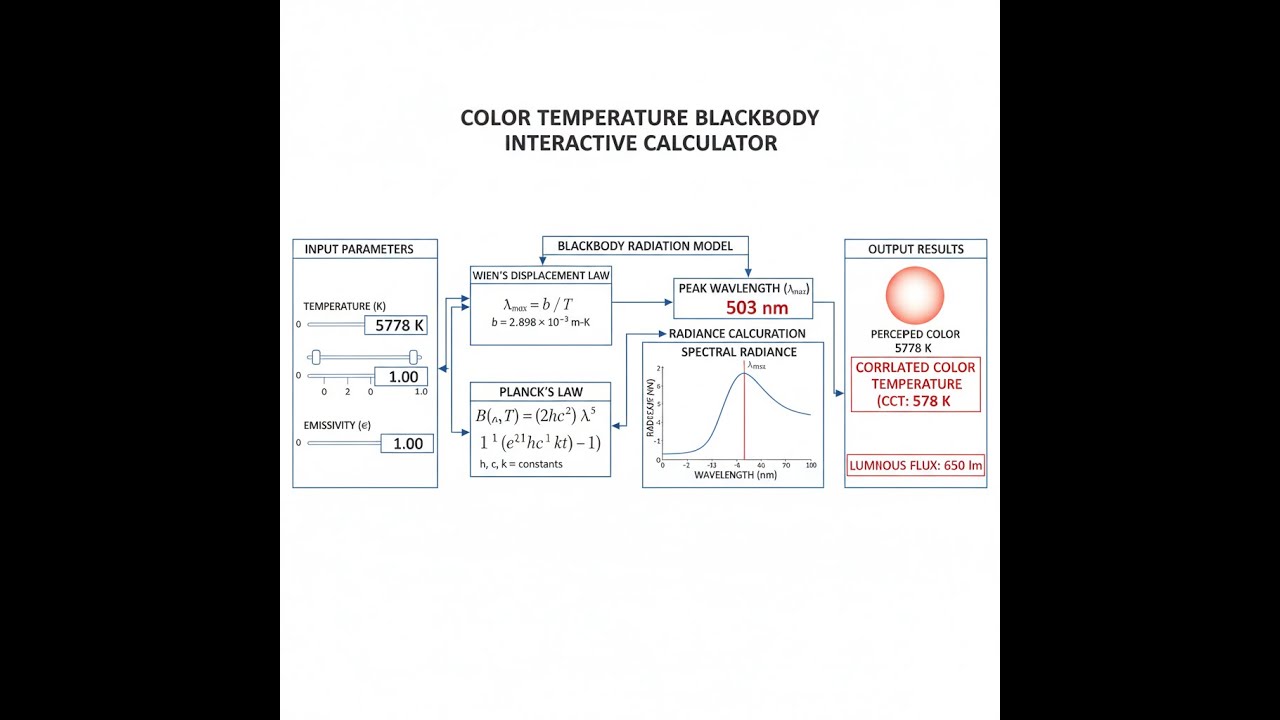
Color Temperature Blackbody Interactive Visualizer
Visualize how blackbody radiation color and intensity change with temperature using Wien's displacement law and Planck's radiation equation. Watch the spectral curve shift from infrared to visible light as temperature increases.
PEAK WAVELENGTH
966 nm
TOTAL EXITANCE
4.59 MW/m²
COLOR REGION
Infrared
CIE CHROMATICITY
0.437, 0.404
FIRGELLI Automations — Interactive Engineering Calculators
Equations & Formulas
Simple Example
Take a blackbody at 3000K — roughly the temperature of a tungsten incandescent bulb.
- Peak wavelength (Wien's Law): 2.898 × 10⁻³ / 3000 = 966 nm — near-infrared, which is why most energy from an incandescent is heat, not light.
- Total radiant exitance (Stefan-Boltzmann): 5.670 × 10⁻⁸ × 3000⁴ = 4.59 × 10⁶ W/m²
- CIE chromaticity: approximately x = 0.437, y = 0.404 — warm orange-white on the Planckian locus.
Wien's Displacement Law
Use the formula below to calculate peak emission wavelength from temperature.
λmax = b / T
Where:
λmax = Peak wavelength of emission (meters)
b = Wien's displacement constant = 2.897771955 × 10⁻³ m·K
T = Absolute temperature (Kelvin)
Planck's Radiation Law (Spectral Radiance)
Use the formula below to calculate spectral radiance at a specific wavelength and temperature.
Bλ(λ, T) = (2hc²) / (λ⁵(ehc/λkT - 1))
Where:
Bλ = Spectral radiance (W·m-2·sr-1·m-1)
h = Planck constant = 6.62607015 × 10⁻³⁴ J·s
c = Speed of light = 2.99792458 × 10⁸ m/s
λ = Wavelength (meters)
k = Boltzmann constant = 1.380649 × 10⁻²³ J/K
T = Absolute temperature (Kelvin)
Stefan-Boltzmann Law (Total Radiant Exitance)
Use the formula below to calculate total radiated power per unit area from a blackbody surface.
M = σT4
Where:
M = Total radiant exitance (W/m²)
σ = Stefan-Boltzmann constant = 5.670374419 × 10⁻⁸ W·m-2·K-4
T = Absolute temperature (Kelvin)
CIE Chromaticity Approximation (McCamy's Formula)
Use the formula below to calculate CIE 1931 chromaticity coordinates from correlated color temperature.
x = -0.2661239(10⁹/T³) - 0.2343589(10⁶/T²) + 0.8776956(10³/T) + 0.179910
y = -1.1063814x³ - 1.34811020x² + 2.18555832x - 0.20219683 (for T ≥ 2222K)
Where:
x, y = CIE 1931 chromaticity coordinates (dimensionless)
T = Correlated color temperature (Kelvin)
Theory & Engineering Applications
Blackbody Radiation Physics
A blackbody is an idealized physical object that absorbs all incident electromagnetic radiation regardless of frequency or angle of incidence, and consequently emits thermal radiation with a characteristic spectrum and intensity determined solely by its temperature. This concept, central to quantum mechanics development, provides the theoretical foundation for understanding thermal emission from stars, heated metals, incandescent lamps, and numerous industrial heating processes. Max Planck's 1900 solution to the ultraviolet catastrophe—the failure of classical physics to predict blackbody spectra at short wavelengths—introduced energy quantization and birthed quantum theory.
Real-world objects approximate blackbody behavior with varying degrees of accuracy characterized by their emissivity (ε), a dimensionless factor between 0 and 1 representing the ratio of actual emitted radiation to ideal blackbody emission. Graphite exhibits emissivity near 0.98 in the infrared, making it an excellent practical blackbody. Polished metals typically show emissivity values of 0.02-0.15, reflecting most incident radiation rather than absorbing and re-emitting it. This distinction becomes critical in infrared thermography where surface emissivity variations can introduce measurement errors exceeding 50°C if not properly compensated.
Wien's Displacement Law and Peak Emission
Wien's displacement law reveals that as temperature increases, the peak wavelength of emission shifts toward shorter wavelengths following an inverse relationship. At room temperature (293K), peak emission occurs at approximately 9.9 micrometers in the mid-infrared—well beyond human vision but detectable by thermal cameras. The Sun's photosphere at approximately 5778K peaks at 501 nanometers in the green portion of visible spectrum, though our eyes perceive integrated solar radiation as white due to substantial emission across all visible wavelengths. This relationship enables remote temperature measurement through spectral analysis, a technique employed in pyrometry, astrophysics, and fusion reactor diagnostics.
An often-overlooked implication involves the T-1 relationship: doubling temperature halves peak wavelength. A steel ingot heated from 1000K (infrared emission appearing dull red) to 2000K shifts peak emission from 2898nm to 1449nm, moving deeper into the visible red spectrum and appearing brighter orange. At 4000K, peak emission reaches 724nm (deep red), but substantial violet and blue emission begins, producing the "white hot" appearance of arc welding and high-intensity discharge lamps. This non-linear perceptual response complicates visual temperature estimation in industrial settings.
Stefan-Boltzmann Law and Total Power Emission
The Stefan-Boltzmann law's T4 dependence produces dramatic effects across temperature ranges. A blackbody at 1000K emits 56.7 kW/m² while the same surface at 2000K emits 907.3 kW/m²—a sixteen-fold increase for doubling temperature. This fourth-power relationship drives thermal runaway in systems lacking adequate cooling, explains the enormous radiative heat transfer from fusion plasma confined at 100 million Kelvin, and constrains spacecraft thermal design where radiator area becomes critically mass-limited.
In LED lighting thermal management, junction temperatures near 400K can produce sufficient radiative losses to affect phosphor conversion efficiency, creating nonlinear relationships between drive current and luminous output. Designers must account for approximately 2.56 times greater radiative heat transfer from a junction at 400K compared to 300K ambient, though conduction typically dominates in properly designed systems. High-power laser diodes operating at elevated junction temperatures experience similar thermal management challenges where radiative contribution increases significantly beyond 450K.
Chromaticity and Color Perception
The CIE 1931 chromaticity diagram maps human color perception onto a two-dimensional space using x and y coordinates derived from tristimulus values representing cone cell responses. Blackbody radiators trace a curved path through this space called the Planckian locus, along which correlated color temperature (CCT) is defined. Light sources not falling exactly on this curve—including most LEDs and fluorescent lamps—are characterized by their CCT (nearest Planckian point) and Duv (perpendicular distance from locus), typically measured in color-matching units.
A critical non-obvious insight: two light sources with identical CCT can produce dramatically different color rendering if their spectral power distributions differ significantly. A 3000K incandescent lamp provides continuous spectrum closely matching a 3000K blackbody (CRI approaching 100), while a 3000K phosphor-converted LED may show pronounced spectral peaks and valleys yielding CRI values of 70-95 depending on phosphor formulation. This distinction matters profoundly in museum lighting, surgical illumination, and color-critical manufacturing where accurate material appearance under specified illumination is essential.
Practical Applications in Infrared Thermometry
Non-contact temperature measurement exploits Planck's law by analyzing spectral radiance at specific wavelengths. Two-color pyrometers measure radiance ratios at different wavelengths, providing temperature determination partially independent of emissivity variations—critical when measuring surfaces with unknown or varying emissivity. The technique relies on the wavelength-dependent terms in Planck's equation: radiance ratio changes more rapidly with temperature than absolute radiance at either wavelength alone. Industrial implementations typically use wavelength pairs in near-infrared (0.9-1.1μm) for high-temperature applications above 700°C, or mid-infrared (3-5μm, 8-14μm) for lower temperatures where atmospheric absorption windows provide reliable transmission.
Measurement accuracy degrades significantly below 500K where peak emission shifts beyond 5.8μm and total radiant exitance falls to 3.5 kW/m². Detector sensitivity limitations and atmospheric absorption (particularly by water vapor and CO₂) constrain practical pyrometry to temperatures above approximately 400K for reliable single-point measurements. Multi-spectral imaging pyrometers employing sophisticated algorithms can extend this range, but require careful calibration against known references. Additional thermal and optical calculators support comprehensive thermal system analysis.
Worked Example: LED Lighting Design Analysis
Problem: A lighting engineer is designing a museum display illumination system requiring 3200K color temperature to match late afternoon sunlight through gallery windows. The specification demands CRI greater than 95 for accurate artwork color rendering. Calculate the required blackbody chromaticity coordinates, peak wavelength, total radiant exitance, and spectral radiance at 550nm (peak photopic sensitivity). Determine if a simple incandescent source would provide adequate color rendering, or if a more sophisticated phosphor-converted LED is required.
Given: T = 3200K (target color temperature)
Solution Part 1 - Peak Wavelength (Wien's Law):
λmax = b / T
λmax = (2.897771955 × 10⁻³ m·K) / (3200 K)
λmax = 9.0555 × 10⁻⁷ m
λmax = 905.55 nm
This near-infrared peak explains why incandescent lamps feel hot—most emitted energy falls beyond visible spectrum (380-780nm), with only a small fraction contributing to perceived illumination. Typical tungsten filament efficiency hovers around 5% luminous efficacy, with remaining 95% lost as infrared radiation and conductive/convective losses.
Solution Part 2 - Total Radiant Exitance (Stefan-Boltzmann Law):
M = σT4
M = (5.670374419 × 10⁻⁸ W·m-2·K-4) × (3200 K)4
M = (5.670374419 × 10-8) × (1.04858 × 1014)
M = 5.945 × 10⁶ W/m²
M = 5.945 MW/m²
This enormous power density demonstrates why incandescent filaments must be small—a 100W bulb with 5% luminous efficiency dissipates 95W as heat from a filament measuring perhaps 10mm × 0.5mm (effective area ≈ 5 mm² or 5 × 10⁻⁶ m²), requiring M = 95W / (5 × 10⁻⁶ m²) = 19 MW/m², slightly higher than our blackbody calculation due to filament temperature typically reaching 3400-3600K in actual operation.
Solution Part 3 - CIE Chromaticity Coordinates:
Using McCamy's formula for T = 3200K:
x = -0.2661239(10⁹/T³) - 0.2343589(10⁶/T²) + 0.8776956(10³/T) + 0.179910
x = -0.2661239(10⁹/32768000000) - 0.2343589(10⁶/10240000) + 0.8776956(10³/3200) + 0.179910
x = -0.2661239(0.030518) - 0.2343589(0.097656) + 0.8776956(0.3125) + 0.179910
x = -0.008124 - 0.022882 + 0.274279 + 0.179910
x = 0.4232
For the y coordinate with T ≥ 2222K:
y = -1.1063814x³ - 1.34811020x² + 2.18555832x - 0.20219683
y = -1.1063814(0.4232)³ - 1.34811020(0.4232)² + 2.18555832(0.4232) - 0.20219683
y = -1.1063814(0.075747) - 1.34811020(0.179098) + 0.924770 - 0.20219683
y = -0.083813 - 0.241469 + 0.924770 - 0.202197
y = 0.3973
Solution Part 4 - Spectral Radiance at 550nm:
Using Planck's law at λ = 550nm = 5.5 × 10⁻⁷m:
Bλ = (2hc²) / [λ⁵(ehc/λkT - 1)]
First calculate the exponent term:
hc/λkT = (6.62607015 × 10⁻³⁴ J·s)(2.99792458 × 10⁸ m/s) / [(5.5 × 10⁻⁷ m)(1.380649 × 10⁻²³ J/K)(3200 K)]
hc/λkT = (1.98645 × 10⁻²⁵) / (2.4340 × 10⁻²³)
hc/λkT = 8.1587
Now calculate e8.1587 - 1 = 3484.2 - 1 = 3483.2
Calculate λ5 = (5.5 × 10⁻⁷)⁵ = 5.0315 × 10⁻³³ m⁵
Bλ = 2(6.62607015 × 10⁻³⁴)(2.99792458 × 10⁸)² / [(5.0315 × 10⁻³³)(3483.2)]
Bλ = 2(6.62607015 × 10⁻³⁴)(8.9875 × 10¹⁶) / (1.7524 × 10⁻²⁹)
Bλ = (1.1909 × 10⁻¹⁶) / (1.7524 × 10⁻²⁹)
Bλ = 6.794 × 10¹² W/(m²·sr·m)
Bλ = 6.794 × 10³ W/(m²·sr·nm)
Solution Part 5 - Color Rendering Analysis:
An ideal blackbody or tungsten incandescent source at 3200K provides continuous spectral distribution with CRI approaching 100, exceeding the specification requirement of CRI > 95. The calculated chromaticity coordinates (x=0.4232, y=0.3973) place this source on the Planckian locus, ensuring zero Duv offset and optimal color perception.
However, a phosphor-converted LED achieving 3200K CCT typically exhibits distinct spectral peaks: blue LED emission around 450-460nm, yellow phosphor emission broadly centered near 560nm, and often a red phosphor component around 620nm. While this can achieve CRI values of 95+ with advanced tri-phosphor formulations, the discontinuous spectrum creates subtle differences in color rendering of specific pigments, particularly deep reds and saturated blues. For critical museum applications where artwork contains historical pigments with narrow spectral reflectance characteristics, the continuous spectrum of an incandescent or halogen source remains preferable despite lower energy efficiency (15-25 lumens/watt versus 80-110 lumens/watt for high-CRI LEDs).
Conclusion: The 3200K blackbody specification yields peak emission at 905.55nm (near-infrared), total radiant exitance of 5.945 MW/m², chromaticity coordinates (0.4232, 0.3973), and spectral radiance of 6.794 kW/(m²·sr·nm) at 550nm. For this demanding museum application, a tungsten halogen source operating at or near 3200K provides superior color fidelity (CRI ≈ 100) compared to even high-quality LEDs, justifying the energy efficiency penalty where accurate color perception is paramount.
Practical Applications
Scenario: Semiconductor Manufacturing Process Control
Dr. Chen, a process engineer at a silicon wafer fabrication facility, monitors rapid thermal processing (RTP) chambers where wafers are heated to 1473K (1200°C) for dopant activation. Traditional thermocouples cannot contact the rotating wafer without contamination risk, so she uses the Color Temperature Blackbody Calculator to verify optical pyrometer calibration. By calculating that peak emission should occur at 1967nm and checking spectral radiance at the pyrometer's 950nm sensing wavelength, she identifies a 35K measurement drift indicating contaminated optics in Chamber 3. Immediate cleaning prevents an entire batch of wafers from receiving insufficient thermal budget, saving $847,000 in scrapped product and avoiding a two-week production delay.
Scenario: Cinematography White Balance Matching
Marcus, a director of photography shooting a period drama, needs to match practical candle lighting (approximately 1850K) with concealed LED fixtures to extend depth of illumination while maintaining visual consistency. Using the calculator, he determines that authentic candlelight should produce chromaticity coordinates around x=0.546, y=0.408 with peak emission at 1566nm (deep infrared), explaining the characteristic warm orange glow. He then specifies custom LED fixtures with 1850K CCT and Duv < 0.002, but the calculator reveals a critical insight: even at matched CCT, LEDs lack the strong infrared component that creates the subtle skin tone warmth and textural richness of genuine firelight. Marcus adjusts his approach, using practical candles for close-ups and carefully gelled LEDs (adding minus-green filtration to correct Duv offset) for background fill, creating seamless integration that earns praise for authentic period atmosphere from both critics and audiences.
Scenario: Astronomical Observation Planning
Elena, an amateur astronomer preparing to image the binary star system Albireo, uses the calculator to predict optimal filter selection for capturing the dramatic color contrast between the orange K-giant primary (approximately 4100K) and blue B-dwarf companion (approximately 13000K). Calculating chromaticity coordinates for both components—(x=0.407, y=0.401) for the primary and (x=0.252, y=0.260) for the companion—she recognizes that standard RGB imaging will clip the companion's strong blue emission while underexposing the primary's red content. She designs a custom imaging sequence using narrowband filters centered at 656nm (H-alpha, capturing primary emission) and 486nm (H-beta, optimizing companion capture), with exposure times weighted by calculated radiant exitance values: 3.32 MW/m² for the primary versus 373 MW/m² for the hotter companion, requiring 11× longer integration on the primary to balance signal levels. The resulting image showcases Albireo's celebrated color contrast with unprecedented fidelity.
Frequently Asked Questions
Why doesn't my 5000K LED look like sunlight even though the Sun's temperature is about 5778K? +
Can I use Wien's law to measure temperature by observing color, and what are the practical limitations? +
What's the physical meaning of negative Duv values in LED specifications, and why does it matter? +
How does atmospheric absorption affect blackbody radiation calculations for remote sensing applications? +
Why do metal surfaces appear to change color more slowly than blackbodies as temperature increases? +
How do I determine the optimal color temperature for different indoor environments and tasks? +
Free Engineering Calculators
Explore our complete library of free engineering and physics calculators.
Browse All Calculators →🔗 Explore More Free Engineering Calculators
About the Author
Robbie Dickson — Chief Engineer & Founder, FIRGELLI Automations
Robbie Dickson brings over two decades of engineering expertise to FIRGELLI Automations. With a distinguished career at Rolls-Royce, BMW, and Ford, he has deep expertise in mechanical systems, actuator technology, and precision engineering.
Need to implement these calculations?
Explore the precision-engineered motion control solutions used by top engineers.


