Fine-grained soils change behavior dramatically depending on how much water they contain — and if you don't know where those transition points are, you're guessing at foundation performance, slope stability, and earthwork design. Use this Atterberg Limits Plasticity Calculator to calculate plasticity index, liquidity index, consistency index, activity number, and related parameters using liquid limit, plastic limit, and natural moisture content inputs. These limits are critical for geotechnical foundation design, highway embankment engineering, and landfill liner material selection. This page includes the core formulas, a worked example, full theory, and a FAQ covering common field and lab interpretation questions.
What is Atterberg Limits Plasticity?
Atterberg limits are moisture content thresholds that mark where a fine-grained soil shifts between solid, semisolid, plastic, and liquid states. The plasticity index — the gap between the liquid limit and plastic limit — tells you how wide that plastic range is for a given soil.
Simple Explanation
Think of clay soil like modeling clay from a craft store. Straight out of a dry bag it's brittle and crumbles — that's the solid state. Add a little water and it becomes moldable — that's the plastic range. Add too much water and it slumps like a thick paste — that's the liquid state. Atterberg limits simply measure the exact moisture percentages where those transitions happen, so engineers know what the soil will do before they build on it.
📐 Browse all 1000+ Interactive Calculators
Table of Contents
Atterberg Limits Diagram

Atterberg Limits Plasticity Calculator
How to Use This Calculator
- Select your desired calculation mode from the dropdown — plasticity index, liquidity index, consistency index, activity number, natural moisture content, or plastic limit.
- Enter the required input values for your selected mode — liquid limit, plastic limit, natural moisture content, plasticity index, clay fraction, liquidity index, or consistency index as prompted.
- Use the Try Example button to load a pre-filled sample dataset if you want to see how the calculator works before entering your own values.
- Click Calculate to see your result.
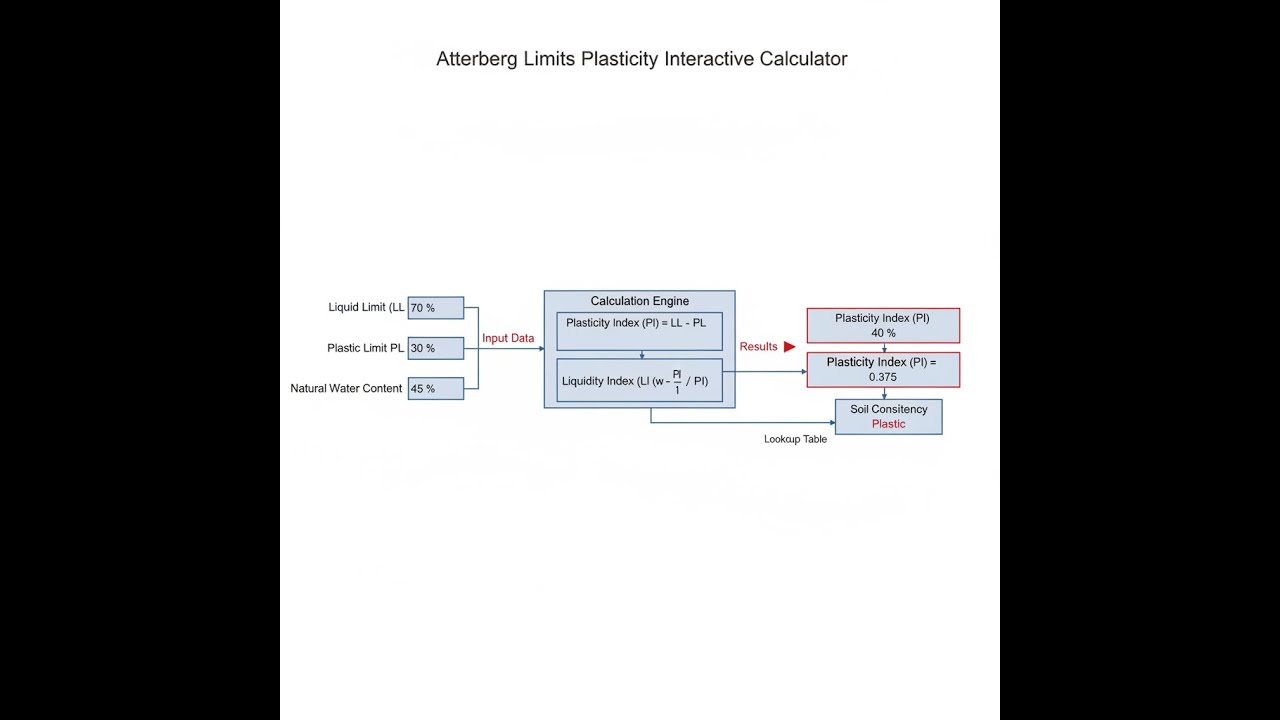
Atterberg limits plasticity interactive visualizer
Visualize how fine-grained soils transition between solid, plastic, and liquid states as moisture content changes. Watch the plasticity index, liquidity index, and soil consistency update in real-time.
PLASTICITY INDEX
30%
LIQUIDITY INDEX
0.50
CONSISTENCY INDEX
0.50
SOIL STATE
PLASTIC
FIRGELLI Automations — Interactive Engineering Calculators
Equations & Formulas
Use the formula below to calculate plasticity index.
Plasticity Index
PI = LL - PL
PI = Plasticity Index (%)
LL = Liquid Limit (% moisture content)
PL = Plastic Limit (% moisture content)
Use the formula below to calculate liquidity index.
Liquidity Index
LI = (w - PL) / PI
LI = Liquidity Index (dimensionless)
w = Natural moisture content (%)
PL = Plastic Limit (%)
PI = Plasticity Index (%)
Use the formula below to calculate consistency index.
Consistency Index
CI = (LL - w) / PI
CI = Consistency Index (dimensionless)
LL = Liquid Limit (%)
w = Natural moisture content (%)
PI = Plasticity Index (%)
Note: CI + LI = 1.0 (complementary indices)
Use the formula below to calculate activity number.
Activity Number
A = PI / Cf
A = Activity Number (dimensionless)
PI = Plasticity Index (%)
Cf = Clay Fraction (% finer than 2 microns)
Simple Example
Soil sample with LL = 50%, PL = 20%, natural moisture content w = 35%, clay fraction = 40%.
- Plasticity Index: PI = 50 − 20 = 30% (high plasticity)
- Liquidity Index: LI = (35 − 20) / 30 = 0.50 (medium stiff)
- Consistency Index: CI = (50 − 35) / 30 = 0.50 (soft)
- Activity Number: A = 30 / 40 = 0.75 (normal activity — illite)
Theory & Engineering Applications
Atterberg limits represent fundamental phase boundaries in the water-soil system, defining the moisture contents where cohesive soils transition between distinct states of consistency. Developed by Swedish agriculturalist Albert Atterberg in 1911 and later standardized by Arthur Casagrande for geotechnical engineering, these empirical indices provide quantitative measures of soil plasticity—the ability to undergo deformation without cracking or crumbling. The liquid limit (LL) marks the moisture threshold where soil transitions from plastic to liquid behavior; the plastic limit (PL) defines the moisture content below which soil becomes brittle and non-plastic; and the shrinkage limit (SL) identifies the moisture content below which further drying produces no volume change. The difference between liquid and plastic limits yields the plasticity index (PI), which quantifies the moisture range over which soil exhibits plastic behavior and serves as the single most important classification parameter for fine-grained soils.
Fundamental Physical Mechanisms
The plastic behavior of fine-grained soils originates from the surface chemistry of clay minerals and their interaction with water molecules. Clay particles possess permanent negative charges on basal surfaces and pH-dependent charges on edge surfaces, creating an electrical double layer when surrounded by water. As moisture content increases, water molecules hydrate clay surfaces, creating adsorbed water layers that lubricate particle-to-particle contacts. At the plastic limit, the water film thickness reaches approximately 10-20 nanometers—sufficient to allow particles to slide past one another without separation. At the liquid limit, the water film expands to 30-50 nanometers, and the soil-water mixture behaves as a viscous fluid under applied shear stress. The plasticity index directly correlates with the specific surface area of clay minerals: kaolinite (10-30 m²/g) exhibits PI values of 10-25%, illite (80-100 m²/g) ranges from 25-50%, and montmorillonite (700-840 m²/g) can exceed 400% plasticity index due to interlayer swelling.
Liquid Limit Determination and Flow Behavior
The Casagrande liquid limit test measures the moisture content at which a standard groove closure of 12.7 mm (0.5 inches) occurs in 25 blows of a mechanical cup apparatus. This seemingly arbitrary criterion actually corresponds to an undrained shear strength of approximately 1.7-2.0 kPa (25-30 psf), representing the boundary between plastic deformation and viscous flow. The test captures soil behavior at very low effective stresses, making it particularly relevant for understanding soft foundation soils, marine clays, and slopes approaching failure. Modern geotechnical laboratories supplement or replace the Casagrande cup with fall cone penetrometers, which measure liquid limit as the moisture content producing 20 mm cone penetration under standard cone weight and geometry. The fall cone method offers superior repeatability (coefficient of variation typically 2-3% versus 5-8% for the Casagrande cup) and eliminates operator bias inherent in manual groove cutting and blow counting. British Standard BS 1377 and European norm EN ISO 17892-6 have adopted the fall cone as the preferred method, though ASTM D4318 retains the Casagrande cup as the primary standard in North America.
Plastic Limit and Brittleness Threshold
The plastic limit test requires rolling a soil thread to 3.2 mm (1/8 inch) diameter, with the PL defined as the moisture content where the thread crumbles into pieces 3-10 mm long. This procedure identifies the moisture threshold where capillary tension between pore water exceeds the soil's tensile strength, causing brittle fracture rather than plastic flow. The plastic limit typically correlates with undrained shear strengths of 100-200 kPa (1-2 tsf), approximately two orders of magnitude stronger than liquid limit conditions. For most clays, the plastic limit coincides with moisture contents producing maximum dry density in standard Proctor compaction tests, making PL a critical reference for earthwork specifications. The rolling test introduces significant operator variability (coefficient of variation 8-15%), leading researchers to propose alternative methods including thread extrusion devices and penetrometer-based techniques. However, the manual rolling procedure remains standard practice worldwide due to its simplicity and correlation with field compaction behavior.
Plasticity Index and Soil Classification
The plasticity index serves as the primary classification parameter in the Unified Soil Classification System (USCS) and AASHTO soil classification system. The Casagrande plasticity chart plots liquid limit versus plasticity index, with the A-line (PI = 0.73(LL - 20)) separating predominantly clay behavior from silty behavior. Soils plotting above the A-line with LL less than 50 classify as lean clay (CL); above the A-line with LL exceeding 50 classify as fat clay (CH). Soils below the A-line classify as low-plasticity silt (ML) or high-plasticity elastic silt (MH). This empirical classification correlates strongly with engineering properties: high-plasticity clays exhibit greater shrink-swell potential, lower permeability (10⁻⁸ to 10⁻¹⁰ cm/s versus 10⁻⁵ to 10⁻⁷ cm/s for low-plasticity soils), higher compressibility, and slower consolidation rates. The plasticity index also governs the activity number (A = PI / clay fraction), which identifies clay mineral type: inactive clays like kaolinite exhibit A less than 0.75, normal clays like illite range from 0.75-1.25, and active montmorillonitic clays exceed 1.25. High activity numbers (A greater than 1.5) signal problematic expansive soils requiring special foundation design considerations.
Liquidity and Consistency Indices
The liquidity index (LI) and consistency index (CI) relate in-situ moisture content to Atterberg limits, providing a normalized measure of soil consistency. A liquidity index of zero indicates soil at plastic limit; LI = 1.0 corresponds to liquid limit; negative values indicate soil stiffer than plastic limit; and values exceeding 1.0 indicate liquid states. Clays with LI less than 0.25 typically exhibit stiff to hard consistency with undrained shear strengths exceeding 100 kPa; LI between 0.25-0.75 indicates medium to soft consistency (25-100 kPa); and LI above 0.75 signals very soft conditions (less than 25 kPa). The consistency index provides a complementary perspective, with CI = 1 - LI. Quick clays—highly sensitive marine clays prone to liquefaction—often exhibit LI values approaching or exceeding 1.0 in their intact state, with undisturbed shear strengths of 25-50 kPa that collapse to less than 1 kPa upon remolding. The liquidity index directly influences bearing capacity factors, settlement magnitudes, and slope stability calculations in soft clay deposits.
Practical Engineering Correlations
Empirical correlations link Atterberg limits to numerous engineering properties, though site-specific calibration improves reliability. Undrained shear strength (su) for normally consolidated clays approximates su = σ'v / 200 × (LL / w)2, where σ'v represents effective overburden stress and w denotes natural moisture content. Compression index (Cc) correlates with Cc = 0.009(LL - 10) for remolded clays, with natural structured clays typically exhibiting 20-40% higher values. Permeability decreases exponentially with plasticity index: k ≈ 10⁻⁹ × 10⁻⁰⁰⁴⁵×ᴾᴵ cm/s provides order-of-magnitude estimates. Shrinkage limit typically ranges from 10-20% for most clays, with the shrinkage index (PI - SL) governing volume change potential: values below 15% indicate low shrink-swell potential, 15-30% suggest moderate potential, and values exceeding 30% signal high shrink-swell risk requiring specialized foundation systems. These correlations provide preliminary design parameters but cannot substitute for direct laboratory measurements on project-specific soils.
Worked Example: Foundation Design Classification
A geotechnical investigation for a commercial building expansion recovered Shelby tube samples from a soft clay layer at 4.8 meters depth. Laboratory testing yielded the following results: liquid limit LL = 62.3%, plastic limit PL = 27.8%, natural moisture content w = 48.6%, clay fraction (particles finer than 2 microns) Cf = 47.2%. Determine the plasticity index, USCS classification, liquidity index, consistency state, and activity number to evaluate foundation design requirements.
Step 1: Calculate Plasticity Index
PI = LL - PL = 62.3% - 27.8% = 34.5%
The plasticity index of 34.5% indicates high plasticity, suggesting significant clay mineral content with substantial potential for volume change and compressibility.
Step 2: USCS Classification
The soil plots on the Casagrande plasticity chart with LL = 62.3% (greater than 50%) and PI = 34.5%. Since LL exceeds 50, we evaluate the A-line criterion for high-plasticity soils:
A-line value = 0.73(LL - 20) = 0.73(62.3 - 20) = 0.73(42.3) = 30.9%
Since PI = 34.5% is greater than 30.9%, the soil plots above the A-line.
USCS Classification: CH (Fat Clay)
Fat clays exhibit high compressibility, low permeability (typically 10⁻⁹ to 10⁻¹⁰ cm/s), and significant consolidation settlement potential. Deep foundation systems or preloading with surcharge will likely be required.
Step 3: Calculate Liquidity Index
LI = (w - PL) / PI = (48.6 - 27.8) / 34.5 = 20.8 / 34.5 = 0.603
The liquidity index of 0.603 places the in-situ soil firmly within the plastic range, approximately 60% of the way between plastic and liquid limits.
Step 4: Assess Consistency State
Based on LI = 0.603 (between 0.5 and 0.75), the clay exhibits soft consistency. This correlates with undrained shear strengths in the range of 25-50 kPa (500-1000 psf), confirming that standard shallow foundations would experience bearing capacity issues and excessive settlement.
For verification, we can estimate undrained shear strength using the correlation su = σ'v / 200 × (LL / w)². Assuming the clay layer has saturated unit weight γsat = 17.5 kN/m³ and the water table is at ground surface, effective overburden stress at 4.8 m depth: σ'v = (17.5 - 9.81) × 4.8 = 36.9 kPa. Estimated su = 36.9 / 200 × (62.3 / 48.6)² = 0.185 × 1.643 = 30.4 kPa, confirming soft consistency.
Step 5: Calculate Activity Number
A = PI / Cf = 34.5 / 47.2 = 0.731
The activity number of 0.731 (just below 0.75) classifies the clay as inactive to normal activity, suggesting kaolinite or illite mineralogy rather than highly expansive montmorillonite. While the clay exhibits high plasticity due to significant clay fraction, the moderate activity indicates limited swelling potential compared to bentonitic clays.
Step 6: Calculate Consistency Index
CI = (LL - w) / PI = (62.3 - 48.6) / 34.5 = 13.7 / 34.5 = 0.397
Verification: CI + LI = 0.397 + 0.603 = 1.000 ✓
Engineering Implications:
This fat clay with soft consistency and LI = 0.603 presents several foundation challenges: (1) Low bearing capacity requiring deep foundations such as driven piles or drilled shafts extending through the soft clay into bearing strata; (2) Significant consolidation settlement potential—the high plasticity and soft consistency indicate compression index Cc ≈ 0.009(62.3 - 10) = 0.47, suggesting primary consolidation settlements of 150-300 mm for typical building loads unless preloading or ground improvement is implemented; (3) Construction-induced pore pressures will dissipate slowly due to low permeability, requiring 6-18 months consolidation time per meter of drainage path; (4) The moderate activity number (A = 0.73) indicates manageable shrink-swell potential, though seasonal moisture variations may still produce 25-50 mm surface movements affecting shallow slabs-on-grade. The design should incorporate either deep foundations bypassing the soft clay layer, or ground improvement techniques such as preloading with wick drains, deep soil mixing, or grouting to densify and strengthen the bearing stratum.
Laboratory Testing Standards and Quality Control
ASTM D4318 specifies standard procedures for liquid and plastic limit testing, requiring air-dried soil passing the No. 40 (0.425 mm) sieve. Sample preparation critically influences results: oven-dried samples cannot be used because irreversible clay particle aggregation occurs above 60°C, permanently altering plasticity characteristics. Samples must be dried at temperatures below 50°C or air-dried at room temperature, then pulverized and mixed with distilled water to achieve uniform moisture distribution. A minimum 16-hour mellowing period allows moisture equilibration throughout the sample. For liquid limit testing, at least four moisture contents spanning the range of 15-35 blows should be tested, with flow curve plotting on semi-logarithmic paper (blows on log scale, moisture on linear scale). The liquid limit corresponds to the moisture content at 25 blows, determined by linear interpolation on the flow curve.
Quality control requires flow index (slope of flow curve) between 5-20 for most clays; values outside this range suggest improper sample preparation or testing errors. The plastic limit test requires rolling at least three threads for each determination, with results repeatable within 1-2 percentage points. Coefficient of variation exceeding 10% for replicate plastic limit tests indicates poor technique or heterogeneous samples requiring additional testing.
For additional geotechnical engineering tools and calculators, visit the FIRGELLI Engineering Calculator Library.
Practical Applications
Scenario: Highway Embankment Design
Marcus, a geotechnical engineer with the state department of transportation, is designing a 7.3-meter-high embankment for a new highway interchange over soft clay deposits. His soil borings revealed a 4.2-meter-thick clay layer with LL = 71.4%, PL = 32.6%, and natural moisture content w = 58.3%. Using the Atterberg Limits Calculator, Marcus calculates PI = 38.8% (fat clay, CH classification) and LI = 0.663 (soft consistency). These results indicate the clay will experience substantial consolidation settlement—he estimates 280 mm of primary consolidation under the embankment load. The high plasticity index and soft consistency lead Marcus to specify a staged construction approach with 3.7 meters of temporary surcharge, combined with prefabricated vertical drains on 1.5-meter spacing to accelerate consolidation. The calculator's classification helps Marcus justify a 14-month preloading period to achieve 90% consolidation before final pavement construction, preventing long-term settlement damage to the roadway.
Scenario: Residential Foundation Investigation
Jennifer, a consulting geotechnical engineer, investigates foundation distress at a 12-year-old residential subdivision where multiple homes show diagonal cracking and door jamb misalignment. Her investigation reveals expansive clay subsoils with LL = 84.2%, PL = 26.7%, and clay fraction of 63.8%. Using the calculator, Jennifer determines PI = 57.5% (fat clay) and activity number A = 0.901 (normal activity). However, the high plasticity index combined with seasonal moisture fluctuations creates a shrinkage index of approximately 42% (PI minus estimated shrinkage limit of 15.5%), indicating high shrink-swell potential. Jennifer's calculations show the clay experiences volume changes of 6-8% with seasonal moisture variation from 32% (near plastic limit during dry periods) to 68% (approaching liquid limit after wet seasons). She recommends remedial measures including installation of edge moisture barriers extending 2.4 meters from foundation perimeters, implementation of consistent landscape irrigation to maintain moisture equilibrium, and underpinning of severely affected homes with drilled piers extending 3.7 meters below seasonal moisture variation depth.
Scenario: Landfill Liner Material Selection
David, an environmental engineer designing a municipal solid waste landfill, must select appropriate clay liner materials meeting regulatory requirements for hydraulic conductivity (permeability less than 1×10⁻⁷ cm/s). He evaluates three potential borrow sources using Atterberg limits testing. Source A shows LL = 42.3%, PL = 19.8%, PI = 22.5% (lean clay, CL); Source B has LL = 67.8%, PL = 28.4%, PI = 39.4% (fat clay, CH); Source C yields LL = 38.7%, PL = 22.1%, PI = 16.6% (borderline CL-ML). Using the calculator and empirical permeability correlation k ≈ 10⁻⁹ × 10⁻⁰⁰⁴⁵ˣᴾᴵ, David estimates Source A permeability at 7.2×10⁻⁸ cm/s, Source B at 1.8×10⁻⁸ cm/s, and Source C at 1.1×10⁻⁷ cm/s. Only Sources A and B meet the permeability requirement, but Source B's high plasticity (PI = 39.4%) makes compaction quality control challenging and increases susceptibility to desiccation cracking. David selects Source A (PI = 22.5%) as optimal—sufficient plasticity for low permeability while maintaining workability for compaction at 2-4% wet of optimum moisture content. The calculator's classification guides his specification requiring PI between 15-30% and percentage passing No. 200 sieve exceeding 30% to ensure adequate fines content for effective sealing.
Frequently Asked Questions
What is the difference between liquid limit and plastic limit, and why do they matter for foundation design? +
How do I interpret the activity number, and what does it tell me about shrink-swell potential? +
What does a negative liquidity index mean, and is it a testing error? +
Can I use Atterberg limits to estimate permeability, or do I need separate hydraulic conductivity testing? +
Why does my soil plot below the A-line with high liquid limit, and what does MH classification mean for construction? +
How do Atterberg limits change with sample preparation, and when should I test air-dried versus field moisture samples? +
Free Engineering Calculators
Explore our complete library of free engineering and physics calculators.
Browse All Calculators →🔗 Explore More Free Engineering Calculators
About the Author
Robbie Dickson — Chief Engineer & Founder, FIRGELLI Automations
Robbie Dickson brings over two decades of engineering expertise to FIRGELLI Automations. With a distinguished career at Rolls-Royce, BMW, and Ford, he has deep expertise in mechanical systems, actuator technology, and precision engineering.
Need to implement these calculations?
Explore the precision-engineered motion control solutions used by top engineers.


