When a product or process failure slips through without a risk score attached, teams end up firefighting instead of preventing — that's exactly the problem FMEA's Risk Priority Number solves. Use this FMEA RPN calculator to calculate numerical risk priority scores using Severity, Occurrence, and Detection ratings on a 1–10 scale. It matters most in manufacturing, automotive, aerospace, and medical device development — anywhere a failure mode reaching the customer has real consequences. This page includes the RPN formula, a worked engineering example, theory on all 3 rating dimensions, and a full FAQ.
What is FMEA Risk Priority Number?
The FMEA Risk Priority Number (RPN) is a score from 1 to 1000 that tells you how risky a potential failure mode is. You get it by multiplying 3 ratings — how severe the failure is, how often it happens, and how hard it is to detect — so teams know which problems to fix first.
Simple Explanation
Think of it like rating a problem on 3 dials: how bad it would be, how likely it is, and how easy it would be to catch before it causes damage. Multiply those 3 numbers together and you get a single score — the higher the score, the more urgent it is to act. A score of 10 barely registers; a score of 700 means something needs fixing now.
📐 Browse all 1000+ Interactive Calculators
Table of Contents
How to Use This Calculator
- Select your calculation mode from the dropdown — standard RPN, reverse-engineer a required rating, action priority, or revised RPN after improvements.
- Enter your Severity (S), Occurrence (O), and Detection (D) ratings, each on a scale of 1 to 10.
- If your mode requires it, enter a Target RPN, Action Threshold, or Revised ratings in the additional fields shown.
- Click Calculate to see your result.
Simple Example
Severity = 7, Occurrence = 5, Detection = 4
RPN = 7 × 5 × 4 = 140
Risk level: HIGH — corrective action required. Focus on reducing severity or occurrence through engineering controls.
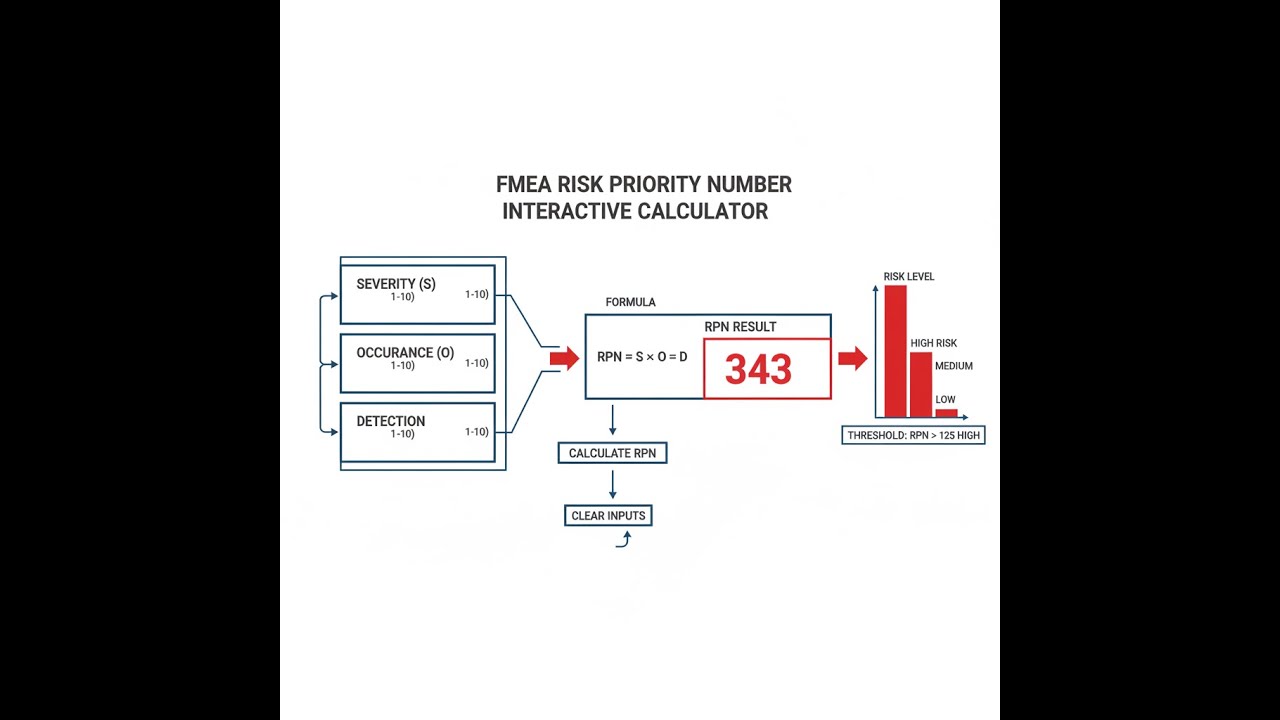
FMEA RPN Diagram

Interactive FMEA Risk Priority Number Calculator
FMEA Risk Priority Number Interactive Calculator
Calculate FMEA Risk Priority Numbers using Severity, Occurrence, and Detection ratings to prioritize corrective actions. Visualize how each rating dimension contributes to overall risk assessment and threshold management.
RPN VALUE
140
RISK LEVEL
HIGH
ACTION REQ'D
YES
PRIORITY
MEDIUM
FIRGELLI Automations — Interactive Engineering Calculators
Equations & Formulas
Use the formula below to calculate the FMEA Risk Priority Number.
Risk Priority Number (RPN)
RPN = S × O × D
S = Severity rating (1-10, dimensionless)
O = Occurrence rating (1-10, dimensionless)
D = Detection rating (1-10, dimensionless)
RPN = Risk priority number (1-1000, dimensionless)
Use the formula below to calculate required individual ratings from a target RPN.
Required Rating Calculation (Reverse Engineering)
Srequired = RPNtarget / (O × D)
Orequired = RPNtarget / (S × D)
Drequired = RPNtarget / (S × O)
RPNtarget = Desired risk priority number (dimensionless)
Use the formula below to calculate RPN reduction after corrective actions.
RPN Reduction After Improvements
ΔRPN = RPNinitial - RPNrevised
Improvement % = (ΔRPN / RPNinitial) × 100
ΔRPN = Change in risk priority number (dimensionless)
RPNinitial = Original RPN before corrective actions (dimensionless)
RPNrevised = Updated RPN after implementing improvements (dimensionless)
Theory & Engineering Applications
Failure Mode and Effects Analysis (FMEA) represents one of the most widely adopted risk assessment methodologies in modern engineering and quality management. The Risk Priority Number serves as the quantitative cornerstone of FMEA, providing a systematic framework for prioritizing corrective actions based on three independent risk dimensions: severity of consequences, frequency of occurrence, and likelihood of detection before reaching the customer or end user.
The Three-Dimensional Risk Model
Unlike simpler risk models that consider only probability and impact, the FMEA RPN methodology incorporates a critical third dimension: detectability. This reflects the engineering reality that not all failures can be prevented, but many can be caught before causing harm. The multiplication of these three factors creates a risk space ranging from 1 (minimal risk: minor consequence, rare occurrence, certain detection) to 1000 (catastrophic risk: severe consequence, inevitable occurrence, no detection capability). This range provides sufficient granularity for meaningful differentiation while avoiding the false precision that would come from continuous probability distributions.
The severity rating quantifies the consequences of a failure mode reaching the end user. Rating scales typically align with regulatory requirements and industry standards. In automotive applications following AIAG guidelines, a severity of 9-10 indicates potential safety hazards or non-compliance with regulations. In medical device manufacturing under FDA guidance, severity ratings correlate directly with patient risk categories. A critical engineering insight often overlooked: severity ratings should reflect the worst-case reasonable scenario, not the average outcome or the absolute worst theoretical case. This distinction prevents both underestimation and paralysis-by-worst-case thinking.
The occurrence rating estimates failure frequency based on historical data, process capability indices, or engineering judgment when empirical data is unavailable. A rating of 10 typically corresponds to failure rates exceeding 1 in 2 (≥50% defect rate), while a rating of 1 suggests failure rates below 1 in 1,500,000. The conversion between occurrence ratings and statistical process metrics is not standardized across industries, creating one of the methodology's practical limitations. In aerospace applications, occurrence ratings often link directly to mean time between failures (MTBF) data, while in software FMEA they may correlate with defect density metrics from version control systems.
The detection rating assesses the probability that existing controls will identify a failure mode before it reaches the next stage or the customer. This rating reflects the effectiveness of inspection methods, testing protocols, statistical process control, and automated monitoring systems. A common engineering mistake is rating detection based on theoretical capability rather than demonstrated performance. A 100% inspection process that relies on visual examination by fatigued operators may warrant a detection rating of 5-7, while automated vision systems with statistical validation might justify a rating of 2-3, despite both being "100% inspection" on paper.
RPN Thresholds and Action Priority Logic
Organizations establish RPN thresholds to trigger mandatory corrective action, typically ranging from 80 to 125 depending on industry risk tolerance. However, a less-known best practice involves using a matrix of thresholds rather than a single value. Many advanced FMEA practitioners employ dual criteria: any RPN exceeding the global threshold (e.g., 100) requires action, but so does any failure mode where severity equals 9 or 10, regardless of RPN. This prevents the mathematical artifact where a catastrophic failure (S=10) with very low occurrence (O=1) and excellent detection (D=2) yields an RPN of 20—below the action threshold but clearly unacceptable from a safety perspective.
The allocation of improvement resources based on RPN ranking faces a subtle optimization challenge. Reducing an RPN from 350 to 175 feels more significant than reducing it from 90 to 45, yet both represent 50% reductions and the latter may require less investment. Some organizations use logarithmic RPN weighting or calculate "risk-reduction return on investment" by dividing RPN reduction by estimated implementation cost. This financial dimension helps justify quality investments to management who think in budget terms rather than risk metrics.
Worked Engineering Example: Hydraulic Actuator Assembly
Consider a precision hydraulic linear actuator assembly for an automated manufacturing cell. The FMEA team identifies a potential failure mode: "Seal degradation causing internal fluid leakage." The team must assign ratings and determine action priority.
Severity Assessment: Internal leakage reduces positioning accuracy and force output. In this application, the actuator controls part placement for robotic welding. Reduced accuracy leads to weld misalignment, potentially creating structural weaknesses in safety-critical assemblies. However, the system includes position feedback that will flag gross errors before welding occurs. After analysis, the team assigns S = 7 (major defect in downstream product, detected before shipping).
Occurrence Assessment: The seal is rated for 5 million cycles at operating temperature and pressure. Production data from similar applications shows seal degradation after approximately 3.8 million cycles on average (1 standard deviation below rating). The manufacturing cell operates 18 hours/day, performing 12 cycles/hour, equivalent to 78,840 cycles/year. Expected seal life is therefore 3,800,000 ÷ 78,840 = 48.2 years, though preventive maintenance occurs every 24 months. Using historical data, seal-related failures occur in approximately 1 in 150 maintenance cycles. This corresponds to O = 4 (occasional failure, approximately 1 in 200 to 1 in 2000).
Detection Assessment: The actuator includes an integrated displacement transducer providing real-time position feedback. The control system monitors position error and flags deviations exceeding 0.25 mm. Internal leakage causes gradual position drift that exceeds this threshold after approximately 15-20% seal degradation—well before critical failure. However, the detection relies on proper sensor calibration and PLC programming logic that has experienced software bugs in the past. The team assigns D = 4 (high likelihood of detection through automated checks, but some uncertainty exists).
Initial RPN Calculation:
RPN = S × O × D = 7 × 4 × 4 = 112
This exceeds the company's action threshold of 100, requiring corrective action. The team evaluates three improvement strategies:
Option 1 - Enhanced Seal Material: Switching to a fluorocarbon seal with superior chemical resistance and temperature stability could reduce occurrence from O=4 to O=2 (failure rate 1 in 15,000), giving RPN = 7 × 2 × 4 = 56. Cost: $180 per actuator (vs. $45 for current seal). Volume: 24 actuators in the cell.
Option 2 - Pressure Monitoring: Adding a pressure transducer to detect internal leakage through pressure drop analysis. This would improve detection from D=4 to D=2 (very high detection likelihood), giving RPN = 7 × 4 × 2 = 56. Cost: $320 per actuator for sensor, mounting, and PLC programming. Implementation complexity higher due to control system modifications.
Option 3 - Design Modification: Redesigning the weld fixture to include mechanical hard stops that prevent misalignment even if actuator positioning fails. This reduces severity from S=7 to S=4 (minor impact, requires rework but no safety concern), giving RPN = 4 × 4 × 4 = 64. Cost: $4,800 for fixture redesign (one-time), no per-actuator cost.
The team selects Option 1 (enhanced seal) based on cost-benefit analysis: $3,240 total cost (24 × $135 delta) versus $7,680 for Option 2 (24 × $320) or $4,800 for Option 3. The revised RPN of 56 falls well below the action threshold. The team documents this decision in the FMEA worksheet, noting that the enhanced seal will be specified for all future actuator procurements and existing units will transition during the next scheduled maintenance cycle.
Industry-Specific Applications
In automotive manufacturing, FMEA and RPN calculations are mandated by IATF 16949 quality standards and AIAG reference manuals. Supplier FMEAs become contractual documents, with customers reserving the right to audit RPN calculations and reject corrective action plans. The automotive industry has developed detailed rating tables linking occurrence ratings to Cpk values (process capability indices), enabling statistical rigor in occurrence assessments. A process with Cpk = 1.67 (5σ capability) typically warrants O = 2, while Cpk = 1.00 (3σ) corresponds to O = 5-6.
Aerospace applications employ FMEA for both hardware and software systems, with severity ratings often tied directly to SAE ARP4761 safety assessment categories. The consequence of software FMEA is that occurrence ratings may reflect code complexity metrics, cyclomatic complexity, or historical defect density rather than physical failure rates. Detection ratings for software incorporate code coverage metrics from automated testing, with 95% branch coverage potentially justifying D = 3-4 depending on test quality.
Medical device manufacturers operate under FDA Quality System Regulations (21 CFR 820) requiring risk analysis throughout the product lifecycle. FMEA serves as evidence of due diligence in design control, and RPN calculations become part of regulatory submissions. The FDA does not mandate specific RPN thresholds, but auditors scrutinize the rationale behind action decisions. A failure mode with S = 10 (potential patient death) and RPN below the action threshold due to low occurrence or high detection will draw questions about risk acceptance criteria.
Process industries including chemical manufacturing, pharmaceuticals, and food production increasingly use FMEA for process safety management and HACCP (Hazard Analysis Critical Control Points) programs. In these applications, severity ratings may reflect environmental impact, regulatory compliance consequences, or public health risks beyond traditional quality metrics. The multiplication logic of RPN can create challenges here: should a low-probability environmental catastrophe (S=10, O=1, D=8, RPN=80) receive lower priority than a frequent quality issue (S=5, O=8, D=3, RPN=120)? Many organizations supplement RPN with independent severity gates to address this concern.
For those seeking additional resources on engineering calculations and quality management tools, visit our comprehensive engineering calculator library featuring calculators for reliability analysis, statistical process control, and Six Sigma tools.
Practical Applications
Scenario: Medical Device Quality Engineer
Dr. Jennifer Park, a quality engineer at a surgical instrument manufacturer, is conducting a Design FMEA for a new arthroscopic camera system. She identifies a potential failure mode: "Sterilization indicator ink migration into patient contact surfaces." Using documented testing data, she assigns ratings: Severity = 8 (potential patient infection), Occurrence = 3 (happened in 1 of 450 accelerated aging tests), Detection = 5 (visual inspection catches obvious defects but subtle migration might pass). The RPN calculator shows 8 × 3 × 5 = 120, exceeding her company's threshold of 100. She uses the calculator's "revised RPN" mode to model the impact of switching to a biocompatible ink formulation (reducing occurrence to 1) and implementing automated optical inspection (reducing detection to 2), projecting a post-improvement RPN of 16—well within acceptable limits and justifying the $47,000 investment in inspection equipment.
Scenario: Automotive Tier 1 Supplier Quality Manager
Marcus Thompson manages quality for a company supplying brake system components to three major automakers. During a customer audit, the OEM questions why a failure mode with RPN = 88 has no documented corrective action when their threshold is 80. Marcus uses this calculator to demonstrate that while the overall RPN is 88, the severity rating is 9 (safety-critical). He shows how their dual-criteria system (RPN ≥ 100 OR Severity ≥ 9) correctly flagged this for action. He then uses the "required occurrence" mode to calculate that reducing occurrence from 6 to 4 would achieve the target RPN of 72 recommended by the customer. This data-driven presentation, completed in real-time during the audit, satisfies the customer's concern and demonstrates robust risk management without committing to unnecessary severity reduction efforts that would require complete component redesign.
Scenario: Manufacturing Process Engineer
Sofia Ramirez is leading a Process FMEA for a new CNC machining cell producing aerospace turbine components. She identifies 23 potential failure modes, and her team assigns initial ratings to all of them. Rather than manually calculating RPNs on spreadsheets and sorting by hand, she uses this calculator to quickly evaluate each mode, entering the three ratings and immediately seeing the risk level classification and recommendation. For the highest-priority failure mode—"Coolant contamination causing surface finish degradation" with S=6, O=7, D=6 (RPN=252)—she uses the action priority mode to confirm it far exceeds the threshold of 125. She then systematically models improvement scenarios: enhanced filtration (O→4), inline surface roughness measurement (D→3), and tighter coolant change intervals (O→5). The calculator shows that combining enhanced filtration with inline measurement achieves RPN=72, while coolant changes alone only reach RPN=180, helping her prioritize the $23,000 inline measurement system over less effective preventive maintenance intensification.
Frequently Asked Questions
▼ What is an acceptable RPN value, and should I use a universal threshold?
▼ Should I prioritize reducing severity, occurrence, or detection to get the best RPN improvement?
▼ How do I determine occurrence ratings when I don't have historical failure data for a new product or process?
▼ Why did my RPN actually increase after implementing corrective actions, and what should I do about it?
▼ How often should I recalculate RPNs and update my FMEA, and what triggers a revision?
▼ Can I use RPN to compare risks across different products or projects, or is it only valid within a single FMEA?
Free Engineering Calculators
Explore our complete library of free engineering and physics calculators.
Browse All Calculators →🔗 Explore More Free Engineering Calculators
About the Author
Robbie Dickson — Chief Engineer & Founder, FIRGELLI Automations
Robbie Dickson brings over two decades of engineering expertise to FIRGELLI Automations. With a distinguished career at Rolls-Royce, BMW, and Ford, he has deep expertise in mechanical systems, actuator technology, and precision engineering.
Need to implement these calculations?
Explore the precision-engineered motion control solutions used by top engineers.


