Geotechnical lab work hinges on one number — compaction energy per unit volume — and getting it wrong means your field density specs are built on a false reference. Use this Compaction Energy Proctor Interactive Calculator to calculate compaction energy per unit volume using hammer weight, drop height, blows per layer, number of layers, and mold volume. It matters across highway subgrade design, airfield pavement engineering, and earthen dam construction where density targets must tie directly back to a validated lab method. This page includes the core formula, a worked example, theory on Standard vs. Modified Proctor methods, and an FAQ covering common field correlation problems.
What is Compaction Energy in a Proctor Test?
Compaction energy is the amount of mechanical work applied to a soil sample per unit volume during a Proctor test. It tells you how hard you're hitting the soil — and whether that matches the ASTM standard your project specification is based on.
Simple Explanation
Think of it like packing a suitcase — the harder and more times you press down, the more you can fit in. In a Proctor test, a weighted hammer drops repeatedly onto layers of soil inside a mold. The total energy delivered per cubic meter of soil is the compaction energy, and it determines how dense the soil gets. Standard Proctor uses a light hammer with a short drop; Modified Proctor uses a heavier hammer with a taller drop — roughly 4.5 times more energy.
📐 Browse all 1000+ Interactive Calculators
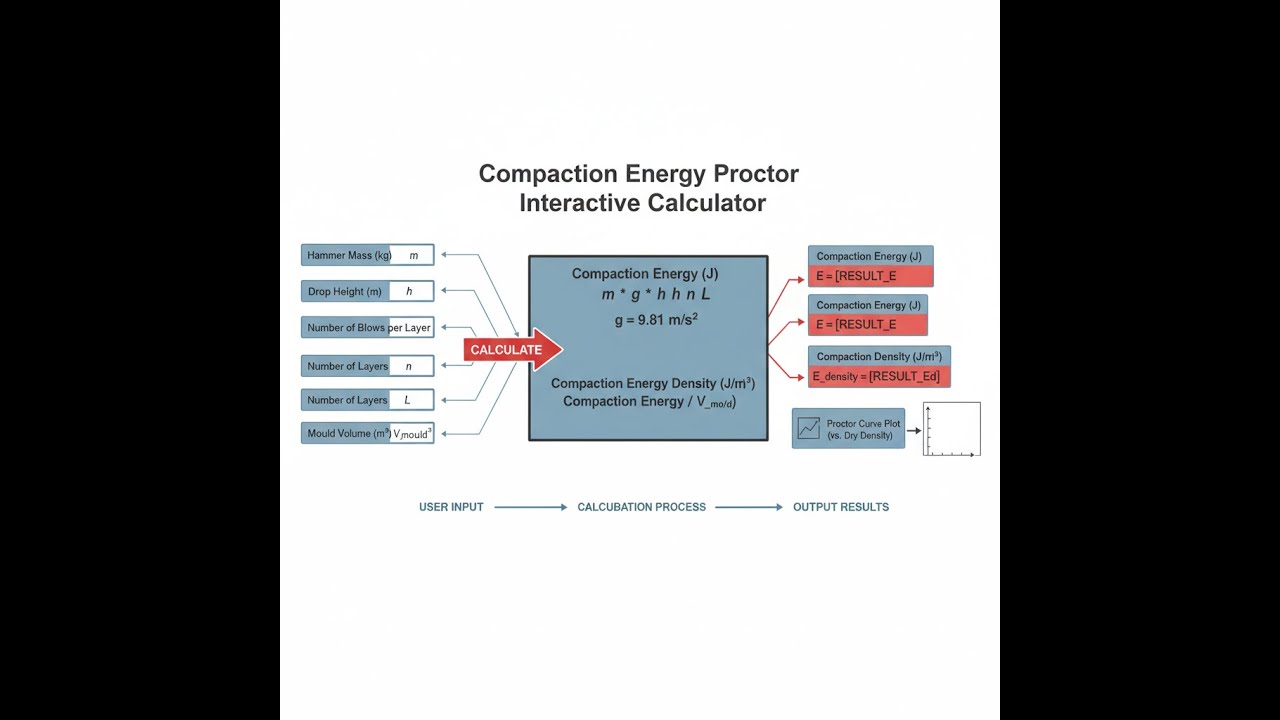
Visual Diagram

Compaction Energy Proctor Interactive Calculator
How to Use This Calculator
- Select your calculation mode from the dropdown — choose whether you want to find compaction energy, hammer weight, drop height, blows per layer, number of layers, or field equivalence.
- Enter the known values into the visible input fields: hammer weight (kg), drop height (mm), blows per layer, number of layers, and mold volume (cm³) — or target energy and field parameters if using a reverse mode.
- Check that your values match your test setup — Standard Proctor uses 2.5 kg / 305 mm / 25 blows / 3 layers / 944 cm³; Modified Proctor uses 4.54 kg / 457 mm / 25 blows / 5 layers / 944 cm³.
- Click Calculate to see your result.
Compaction Energy Proctor Interactive Visualizer
Visualize how hammer weight, drop height, blows per layer, and layers combine to determine total compaction energy. Watch the hammer animation and see how different parameters instantly affect energy output and test classification.
COMPACTION ENERGY
593 kJ/m³
TEST STANDARD
STANDARD
TOTAL BLOWS
75
FIRGELLI Automations — Interactive Engineering Calculators
Equations & Formulas
Use the formula below to calculate compaction energy per unit volume.
Compaction Energy Formula
E = (W × g × H × N × L) / V
E = Compaction energy per unit volume (kJ/m³)
W = Weight of hammer (kg)
g = Gravitational acceleration = 9.81 m/s²
H = Drop height (m)
N = Number of blows per layer (dimensionless)
L = Number of layers (dimensionless)
V = Mold volume (m³)
Standard Proctor (ASTM D698)
EStandard = (2.5 kg × 9.81 m/s² × 0.305 m × 25 blows × 3 layers) / 0.000944 m³ ≈ 593 kJ/m³
Hammer weight: 2.5 kg (5.5 lbs)
Drop height: 305 mm (12 inches)
Blows per layer: 25
Number of layers: 3
Mold volume: 944 cm³ (1/30 ft³)
Modified Proctor (ASTM D1557)
EModified = (4.54 kg × 9.81 m/s² × 0.457 m × 25 blows × 5 layers) / 0.000944 m³ ≈ 2700 kJ/m³
Hammer weight: 4.54 kg (10 lbs)
Drop height: 457 mm (18 inches)
Blows per layer: 25
Number of layers: 5
Mold volume: 944 cm³ (1/30 ft³)
Solving for Other Variables
W = (E × V) / (g × H × N × L)
H = (E × V) / (W × g × N × L)
N = (E × V) / (W × g × H × L)
L = (E × V) / (W × g × H × N)
Simple Example
Standard Proctor setup: 2.5 kg hammer, 305 mm drop, 25 blows per layer, 3 layers, 944 cm³ mold.
E = (2.5 × 9.81 × 0.305 × 25 × 3) / 0.000944
E ≈ 593 kJ/m³ — confirms Standard Proctor (ASTM D698).
Theory & Engineering Applications
Fundamental Principles of Soil Compaction Energy
Soil compaction is a mechanical process that increases soil density by expelling air voids while maintaining relatively constant moisture content. The compaction energy applied during laboratory testing directly correlates to the maximum dry density achievable and the optimal moisture content at which this maximum occurs. Ralph R. Proctor's pioneering work in the 1930s established that compaction effort, quantified as energy per unit volume, fundamentally controls the compaction characteristics of soil materials.
The energy input during compaction overcomes particle-to-particle friction and rearranges soil grains into a denser configuration. Standard Proctor compaction applies approximately 593 kJ/m³, simulating typical field compaction from light to moderate construction equipment. Modified Proctor compaction delivers approximately 2700 kJ/m³ (4.5 times greater), representing heavy vibratory rollers and modern construction equipment used in highway and airfield construction. The critical non-obvious insight is that doubling compaction energy does not double density increase — the relationship follows a logarithmic curve with diminishing returns beyond Modified Proctor levels due to particle crushing and structural rearrangement limitations.
Standard vs. Modified Proctor Methods
The Standard Proctor test (ASTM D698) utilizes a 2.5 kg hammer dropped 305 mm through 25 blows per layer across 3 layers in a 944 cm³ mold. This method was developed to represent field conditions typical of residential construction, light fills, and embankments constructed before the 1950s. The total work input equals (2.5 kg)(9.81 m/s²)(0.305 m)(25)(3) = 560 J, distributed over 0.000944 m³ yielding 593 kJ/m³.
The Modified Proctor test (ASTM D1557) employs a heavier 4.54 kg hammer with greater 457 mm drop height through 25 blows per layer across 5 layers. Calculating: (4.54 kg)(9.81 m/s²)(0.457 m)(25)(5) = 2549 J over 0.000944 m³ yields approximately 2700 kJ/m³. This method became necessary as construction equipment evolved — vibratory rollers, heavy sheepsfoot compactors, and improved construction practices deliver significantly more energy than equipment available when Standard Proctor was established. Modern specifications for highways, airports, and structural fills typically require 95-98% of Modified Proctor maximum dry density.
Energy Transfer Efficiency and Practical Limitations
A crucial but often overlooked aspect is that theoretical compaction energy assumes 100% efficiency in energy transfer from hammer impact to soil densification. Real-world conditions exhibit 70-85% efficiency due to energy losses from elastic rebound, heat generation, equipment friction, and stress wave propagation through the soil mass. Additionally, the compaction curve (dry density vs. moisture content) shows that compaction energy effectiveness depends critically on soil moisture — compaction at moisture contents significantly dry or wet of optimum produces substantially lower densities regardless of energy input.
Field compaction introduces further complexity because roller passes, lift thickness, and soil type interactions create three-dimensional stress distributions fundamentally different from the one-dimensional laboratory test. A vibratory smooth drum roller applying 12 passes at 200 mm lift thickness delivers approximately equivalent energy to Modified Proctor, but the stress distribution, frequency effects, and particle arrangement differ substantially. This is why field density testing (nuclear gauge, sand cone, or drive cylinder methods) remains essential despite laboratory predictions.
Soil Type Dependencies and Engineering Judgment
Different soil classifications respond distinctly to compaction energy. Granular soils (sands and gravels) exhibit relatively flat compaction curves with broad optimal moisture ranges because free-draining particle arrangements respond more to vibration than impact energy. Clay soils display sharp compaction peaks with narrow optimal moisture ranges (typically ±2%) because the compaction mechanism involves breaking down aggregated soil structure and oriented particle arrangement. Silty soils demonstrate intermediate behavior with moderate moisture sensitivity.
A critical engineering consideration rarely emphasized in textbooks: plastic clays compacted significantly wet of optimum may achieve target density but exhibit poor long-term performance due to excessive pore water pressure, reduced shear strength, and susceptibility to volume change. Specifications requiring both density achievement (95% Modified Proctor) AND moisture control (within -2% to +2% of optimum) recognize that energy input alone does not guarantee engineering performance.
Worked Example: Custom Compaction Energy Determination
Problem: A geotechnical laboratory needs to develop a custom compaction test for a soil containing 40% gravel-sized particles (retained on No. 4 sieve), which exceeds the 20% limit for standard 4-inch molds. The project specifies Modified Proctor energy levels but requires a larger 6-inch diameter mold with 2830 cm³ volume. Design the test parameters using a 10 lb (4.54 kg) hammer with 457 mm (18-inch) drop height. Determine the required number of blows per layer if using 5 layers, and verify the resulting energy matches Modified Proctor specifications.
Solution:
Step 1: Calculate Modified Proctor Target Energy
EModified = 2700 kJ/m³ (established specification)
Step 2: Convert Mold Volume to Cubic Meters
V = 2830 cm³ × (1 m³ / 1,000,000 cm³) = 0.002830 m³
Step 3: Apply the Compaction Energy Formula
E = (W × g × H × N × L) / V
Where:
W = 4.54 kg (hammer weight)
g = 9.81 m/s² (gravitational acceleration)
H = 0.457 m (drop height converted from 457 mm)
L = 5 layers (specified)
N = ? (to be determined)
Step 4: Rearrange to Solve for N
N = (E × V) / (W × g × H × L)
N = (2700 kJ/m³ × 0.002830 m³) / (4.54 kg × 9.81 m/s² × 0.457 m × 5 layers)
Step 5: Calculate Numerator
Numerator = 2700 × 0.002830 = 7.641 kJ = 7641 J
Step 6: Calculate Denominator
Denominator = 4.54 × 9.81 × 0.457 × 5 = 101.98 J/blow
Step 7: Solve for N
N = 7641 J / 101.98 J/blow = 74.92 blows per layer
Step 8: Round to Practical Value
N = 75 blows per layer (practical testing value)
Step 9: Verify Resulting Energy
Eactual = (4.54 kg × 9.81 m/s² × 0.457 m × 75 blows × 5 layers) / 0.002830 m³
Eactual = (4.54 × 9.81 × 0.457 × 75 × 5) / 0.002830
Eactual = 7648.5 / 0.002830
Eactual = 2703 kJ/m³
Step 10: Calculate Deviation from Target
Deviation = (2703 - 2700) / 2700 × 100% = 0.11%
Answer: Use 75 blows per layer across 5 layers with the 4.54 kg hammer dropped 457 mm in the 2830 cm³ mold to achieve Modified Proctor energy of 2703 kJ/m³, which deviates only 0.11% from the target 2700 kJ/m³ specification. This custom test procedure will provide compaction characteristics appropriate for the oversized soil particles while maintaining energy equivalence to standard Modified Proctor testing.
Field Compaction Correlation and Quality Control
Translating laboratory compaction energy to field specifications requires understanding equipment characteristics and construction methodology. Vibratory compaction introduces frequency (typically 25-35 Hz) and amplitude variables absent in impact compaction, creating different particle arrangement mechanisms. Smooth drum vibratory rollers excel for granular materials, while padfoot or sheepsfoot rollers with kneading action prove more effective for cohesive soils. The specification of roller type, number of passes, lift thickness, and moisture control collectively determines whether field compaction achieves laboratory-predicted densities.
Quality control testing frequency typically follows specifications requiring one test per 1000 m³ of compacted material or per 150 linear meters for roadway construction. The nuclear density gauge (ASTM D6938) provides rapid in-situ density and moisture determination but requires careful calibration and safety protocols. Sand cone methods (ASTM D1556) offer reliable reference measurements but consume more time. Understanding the relationship between laboratory compaction energy and field testing results enables engineers to adjust construction procedures — if field densities consistently fall short, increasing roller passes, reducing lift thickness, or adjusting moisture content provides practical solutions grounded in energy considerations.
For those seeking additional engineering calculation tools beyond compaction analysis, explore FIRGELLI's comprehensive free engineering calculator library covering structural, mechanical, and materials engineering applications.
Practical Applications
Scenario: Highway Subgrade Quality Control
Marcus, a materials testing technician for a state DOT, conducts Modified Proctor tests on clayey subgrade soils for a highway widening project. The specifications require 95% of Modified Proctor maximum dry density. He performs the test following ASTM D1557 using a 4.54 kg hammer with 457 mm drop height, 25 blows per layer across 5 layers in a 944 cm³ mold. The calculator confirms his test delivers 2703 kJ/m³ compaction energy, validating that his laboratory setup matches the specification requirements. When field density tests show only 92% compaction, Marcus calculates that the contractor's 200 mm lift thickness with 6 roller passes delivers insufficient energy — the calculator's field equivalence mode indicates they need either 9 passes at 200 mm lifts or reduction to 150 mm lifts with 6 passes to achieve specification compliance. This quantitative analysis guides the contractor to adjust field procedures, ultimately achieving the required 95% density and preventing costly project delays.
Scenario: Airport Runway Reconstruction Specifications
Dr. Jennifer Park, a geotechnical consultant designing specifications for a regional airport runway reconstruction, must determine appropriate compaction requirements for the 750 mm thick granular base course. Historical data from the existing pavement shows it was built to Standard Proctor specifications (593 kJ/m³), but modern FAA Advisory Circulars recommend Modified Proctor for heavy aircraft loadings. She uses the calculator to compare energy levels: Standard Proctor delivers 593 kJ/m³ while Modified reaches 2703 kJ/m³ — a 356% increase in compaction effort. For the coarse sand and gravel base material with maximum particle size of 50 mm, she specifies a custom test using a 4.54 kg hammer with 305 mm drop height (reduced from standard 457 mm to accommodate particle size effects), 30 blows per layer across 5 layers in a 2830 cm³ oversized mold. The calculator determines this yields 1741 kJ/m³ — approximately 65% of Modified Proctor energy, which engineering judgment indicates is appropriate for free-draining granular materials where vibration rather than impact governs compaction. Her specification requiring 98% of this custom maximum dry density ensures the runway base will support aircraft loads while recognizing the unique compaction behavior of coarse granular materials.
Scenario: Earthen Dam Core Material Testing
Roberto, a geotechnical engineer evaluating borrow pit materials for an earthen dam core, encounters a low-plasticity clayey silt that the specifications require to be compacted to Standard Proctor energy levels (not Modified) due to concerns about excessive pore pressures in the low-permeability core during reservoir filling. He verifies his laboratory equipment using the calculator: 2.5 kg hammer, 305 mm drop, 25 blows per layer, 3 layers in a 944 cm³ mold yields 593 kJ/m³ as expected. However, field trials show the contractor's vibratory padfoot roller is overcompacting the material — nuclear density gauge readings average 101% of Standard Proctor maximum dry density with moisture contents 3% wet of optimum. The calculator's field equivalence function indicates the 8-pass protocol with 150 mm lifts delivers approximately 890 kJ/m³ — 50% more energy than specified. Roberto recommends reducing to 5 passes at 200 mm lifts to better approximate Standard Proctor energy, preventing excessive compaction that could trap water and compromise long-term dam stability. Three months after reservoir filling, piezometer readings in the modified compaction zone show expected dissipation patterns, confirming the energy-based adjustment achieved the desired engineering behavior.
Frequently Asked Questions
▼ What is the difference between Standard and Modified Proctor tests?
▼ Why does compaction energy matter for construction quality?
▼ How do I correlate laboratory Proctor energy to field roller passes?
▼ What happens if I compact soil at the wrong moisture content?
▼ Can I use Standard Proctor for modern highway construction projects?
▼ How do I handle soils with oversized particles that don't fit standard molds?
Free Engineering Calculators
Explore our complete library of free engineering and physics calculators.
Browse All Calculators →🔗 Explore More Free Engineering Calculators
About the Author
Robbie Dickson — Chief Engineer & Founder, FIRGELLI Automations
Robbie Dickson brings over two decades of engineering expertise to FIRGELLI Automations. With a distinguished career at Rolls-Royce, BMW, and Ford, he has deep expertise in mechanical systems, actuator technology, and precision engineering.
Need to implement these calculations?
Explore the precision-engineered motion control solutions used by top engineers.


